California's 45th congressional district
California's 45th congressional district is a congressional district in the U.S. state of California.
| California's 45th congressional district | |||
|---|---|---|---|
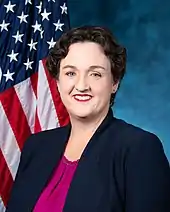
.tif.png.webp) California's 45th congressional district since January 3, 2013 | |||
| Representative |
| ||
| Population (2019) | 791,311 | ||
| Median household income | $115,427[1] | ||
| Ethnicity | |||
| Cook PVI | R+3[3] | ||
The district is based in Orange County and includes all of Irvine, Tustin, North Tustin, Villa Park, Laguna Hills, Lake Forest, and Rancho Santa Margarita, as well as parts of Anaheim, Orange, Laguna Woods, Mission Viejo, and Trabuco Canyon.
Katie Porter, a Democrat, has represented the district since January 2019. In November 2018, Porter defeated Republican incumbent Mimi Walters in the general election and became the first Democrat to win a House race in the district since its inception.
Competitiveness
2018 midterm elections
Incumbent Walters competed against a field of four Democrats and an independent candidate in the primary election for the 2018 midterm elections. On February 25, 2018, UC Irvine (UCI) assistant law professor Dave Min received the endorsement of the California Democratic Party.[4]
Min, former White House senior technology advisor Brian Forde,[5] former legislative assistant to Sherrod Brown (D-OH) Kia Hamadanchy,[6] UCI law professor Katie Porter,[7] and UCI business professor John Graham ran in the "top two" primary in June 2018. Walters and Porter placed first and second and advanced to the general election in November.
On November 14, 2018, 8 days after polls closed, David Wasserman, then the House Editor for The Cook Political Report, projected that Porter had won the general election.[8] Porter is the first Democrat to win a US congressional race in California's 45th congressional district since its creation following the 1980 census.
In statewide races
| Election results from statewide races | ||
|---|---|---|
| Year | Office | Results |
| 1990 | Governor[9] | Wilson 60.5% – 32.3% |
| 1992 | President[10] | Bush 42.3% – 32.2% |
| Senator[11] | Herschensohn 56.6% – 34.0% | |
| Senator (Special)[12] | Seymour 54.5% – 40.4% | |
| 1994 | Governor[13] | Wilson 67.6% – 27.5% |
| Senator[14] | Huffington 58.7% – 31.7% | |
| 1996 | President[15] | Dole 50.5% – 37.9% |
| 1998 | Governor[16] | Lungren 51.7% – 45.0% |
| Senator[17] | Fong 56.2% – 39.4% | |
| 2000 | President[18] | Bush 55.6% – 39.9% |
| Senator[19] | Feinstein 50.0% – 41.8% | |
| 2002 | Governor[20] | Simon 51.5% – 42.3% |
| 2003 | Recall[21][22] | |
| Schwarzenegger 59.6% – 23.5% | ||
| 2004 | President[23] | Bush 56.0% – 43.1% |
| Senator[24] | Boxer 49.5% – 47.0% | |
| 2006 | Governor[25] | Schwarzenegger 65.2% - 31.0% |
| Senator[26] | Feinstein 50.5% – 45.0% | |
| 2008 | President[27] | Obama 51.5% – 46.9% |
| 2010 | Governor[28] | Whitman 50.2% – 43.9% |
| Senator[29] | Fiorina 52.1% – 42.4% | |
| 2012 | President[30] | Romney 54.8% – 43.0% |
| Senator[31] | Emken 55.6% – 44.4% | |
| 2014 | Governor[32] | Kashkari 58.5% – 41.5% |
| 2016 | President[33] | Clinton 49.8% – 44.4% |
| Senator[34] | Harris 66.0% – 34.0% | |
| 2018 | Governor[35] | Cox 50.6% – 49.4% |
| Senator[36] | Feinstein 54.3% – 45.7% | |
| Lieutenant Governor[37] | Kounalakis 56.3% – 43.7% | |
| Secretary of State[37] | Padilla 51.2% – 48.8% | |
| Controller[37] | Yee 52.1% – 47.9% | |
| Treasurer[37] | Ma 51.1% – 48.9% | |
| Attorney General[37] | Becerra 50.8% – 49.2% | |
| Insurance Commissioner[37] | Poizner 59.7% – 40.3% | |
| 2020 | President[38] | Biden 53.6% – 42.5% |
List of members representing the district

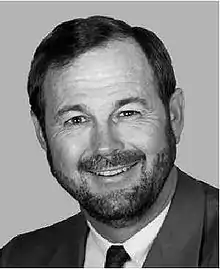


%252C_official_photo_portrait%252C_color.jpg.webp)
.tif.png.webp)
.jpg.webp)
Election results
|
1982 • 1984 • 1986 • 1988 • 1990 • 1992 • 1994 • 1996 • 1998 • 2000 • 2002 • 2004 • 2006 • 2008 • 2010 • 2012 • 2014 • 2016 • 2018 • 2020 |
1982
| Party | Candidate | Votes | % | |
|---|---|---|---|---|
| Republican | Duncan Hunter (Incumbent) | 117,771 | 68.6 | |
| Democratic | Richard Hill | 50,148 | 29.2 | |
| Libertarian | Jack R. Sanders | 3,839 | 2.2 | |
| Total votes | 171,758 | 100.0 | ||
| Republican hold | ||||
1984
| Party | Candidate | Votes | % | |
|---|---|---|---|---|
| Republican | Duncan Hunter (Incumbent) | 149,011 | 75.1 | |
| Democratic | David W. Guthrie | 45,325 | 22.9 | |
| Libertarian | Patrick "Pat" Wright | 3,971 | 2.0 | |
| Total votes | 198,307 | 100.0 | ||
| Republican hold | ||||
1986
| Party | Candidate | Votes | % | |
|---|---|---|---|---|
| Republican | Duncan Hunter (Incumbent) | 118,900 | 58.1 | |
| Democratic | Hewitt Fitts Ryan | 82,800 | 40.5 | |
| Libertarian | Lee Schwartz | 2,975 | 1.4 | |
| Total votes | 204,675 | 100.0 | ||
| Republican hold | ||||
1988
| Party | Candidate | Votes | % | |
|---|---|---|---|---|
| Republican | Duncan Hunter (Incumbent) | 166,451 | 74.0 | |
| Democratic | Pete Lepiscopo | 54,012 | 24.0 | |
| Libertarian | Perry Willis | 4,440 | 2.0 | |
| Total votes | 224,903 | 100.0 | ||
| Republican hold | ||||
1990
| Party | Candidate | Votes | % | |
|---|---|---|---|---|
| Republican | Duncan Hunter (Incumbent) | 123,591 | 72.8 | |
| Libertarian | Joe Shea | 46,068 | 27.2 | |
| Total votes | 169,659 | 100.0 | ||
| Republican hold | ||||
1992
| Party | Candidate | Votes | % | |
|---|---|---|---|---|
| Republican | Dana Rohrabacher (Incumbent) | 123,731 | 54.5 | |
| Democratic | Patricia "Pat" McCabe | 88,508 | 39.0 | |
| Libertarian | Gary David Copeland | 14,777 | 6.5 | |
| Total votes | 227,016 | 100.0 | ||
| Republican hold | ||||
1994
| Party | Candidate | Votes | % | |
|---|---|---|---|---|
| Republican | Dana Rohrabacher (Incumbent) | 124,875 | 69.1 | |
| Democratic | Brett Williamson | 55,849 | 30.9 | |
| Total votes | 180,724 | 100.0 | ||
| Republican hold | ||||
1996
| Party | Candidate | Votes | % | |
|---|---|---|---|---|
| Republican | Dana Rohrabacher (Incumbent) | 125,326 | 61.0 | |
| Democratic | Sally Alexander | 68,312 | 33.2 | |
| Libertarian | Mark Murphy | 8,813 | 4.3 | |
| Natural Law | Rand McDevitt | 3,071 | 1.5 | |
| Total votes | 205,522 | 100.0 | ||
| Republican hold | ||||
1998
| Party | Candidate | Votes | % | |
|---|---|---|---|---|
| Republican | Dana Rohrabacher (Incumbent) | 94,296 | 58.7 | |
| Democratic | Patricia W. Neal | 60,022 | 37.3 | |
| Libertarian | Don Hull | 4,337 | 2.7 | |
| Natural Law | William "Bill" Verkamp Jr. | 2,115 | 1.3 | |
| Total votes | 160,770 | 100.0 | ||
| Republican hold | ||||
2000
| Party | Candidate | Votes | % | |
|---|---|---|---|---|
| Republican | Dana Rohrabacher (Incumbent) | 136,275 | 62.2 | |
| Democratic | Ted Crisell | 71,066 | 32.4 | |
| Libertarian | Don Hull | 8,409 | 3.8 | |
| Natural Law | Constance Betton | 3,635 | 1.6 | |
| Total votes | 219,385 | 100.0 | ||
| Republican hold | ||||
2002
| Party | Candidate | Votes | % | |
|---|---|---|---|---|
| Republican | Mary Bono (Incumbent) | 87,101 | 65.3 | |
| Democratic | Elle K. Kurplewski | 43,692 | 32.7 | |
| Libertarian | Rod Miller-Boyer | 2,740 | 2.0 | |
| Total votes | 133,533 | 100.0 | ||
| Republican hold | ||||
2004
| Party | Candidate | Votes | % | |
|---|---|---|---|---|
| Republican | Mary Bono (Incumbent) | 153,523 | 66.7 | |
| Democratic | Richard J. Meyer | 76,967 | 33.3 | |
| Total votes | 230,490 | 100.0 | ||
| Republican hold | ||||
2006
| Party | Candidate | Votes | % | |
|---|---|---|---|---|
| Republican | Mary Bono (Incumbent) | 99,638 | 60.7 | |
| Democratic | David Roth | 64,613 | 39.3 | |
| Total votes | 164,251 | 100.0 | ||
| Republican hold | ||||
2008
| Party | Candidate | Votes | % | |
|---|---|---|---|---|
| Republican | Mary Bono (Incumbent) | 155,166 | 58.3 | |
| Democratic | Julie Bornstein | 111,026 | 41.7 | |
| Total votes | 266,192 | 100.0 | ||
| Turnout | 74.4 | |||
| Republican hold | ||||
2010
| Party | Candidate | Votes | % | |
|---|---|---|---|---|
| Republican | Mary Bono (Incumbent) | 106,472 | 51.5 | |
| Democratic | Steve Pougnet | 87,141 | 42.1 | |
| American Independent | Bill Lussenheide | 13,188 | 6.4 | |
| Total votes | 206,801 | 100.0 | ||
| Turnout | 60.5 | |||
| Republican hold | ||||
2012
| Party | Candidate | Votes | % | |
|---|---|---|---|---|
| Republican | John Campbell (Incumbent) | 171,417 | 58.5 | |
| Democratic | Sukhee Kang | 121,814 | 41.5 | |
| Total votes | 293,231 | 100.0 | ||
| Republican hold | ||||
2014
| Party | Candidate | Votes | % | |
|---|---|---|---|---|
| Republican | Mimi Walters | 106,083 | 65.1 | |
| Democratic | Drew E. Leavens | 56,819 | 34.9 | |
| Total votes | 162,902 | 100.0 | ||
| Republican hold | ||||
2016
| Party | Candidate | Votes | % | |
|---|---|---|---|---|
| Republican | Mimi Walters (Incumbent) | 182,408 | 58.6 | |
| Democratic | Ron Varasteh | 128,996 | 41.4 | |
| Total votes | 311,404 | 100.0 | ||
| Republican hold | ||||
2018
| Party | Candidate | Votes | % | |||
|---|---|---|---|---|---|---|
| Democratic | Katie Porter | 158,906 | 52.1 | |||
| Republican | Mimi Walters (Incumbent) | 146,383 | 47.9 | |||
| Total votes | 305,289 | 100.0 | ||||
| Democratic gain from Republican | ||||||
2020
| Party | Candidate | Votes | % | |
|---|---|---|---|---|
| Democratic | Katie Porter (Incumbent) | 221,843 | 53.5 | |
| Republican | Greg Raths | 193,096 | 46.5 | |
| Total votes | 414,939 | 100.0 | ||
| Democratic hold | ||||
Historical district boundaries
From 2003 to 2013, this district was based in Riverside County. The district included the communities of Palm Springs, Moreno Valley, Palm Desert, Hemet, Cathedral City, Temecula, Blythe, Rancho Mirage, Murrieta, Indio, Indian Wells, La Quinta, Cabazon, Anza, Thermal, Idyllwild, Coachella, and other unincorporated areas of Riverside County.
References
- US Census
- LA Times
- "Partisan Voting Index – Districts of the 115th Congress" (PDF). The Cook Political Report. April 7, 2017. Retrieved April 7, 2017.
- Hagen, Lisa (February 25, 2018). "California Dems endorse three candidates in pivotal House races". The Hill. Retrieved February 25, 2018.
- Mai-Duc, Christine (July 19, 2017). "Former Obama advisor jumps in to challenge Rep. Mimi Walters in Orange County". Los Angeles Times. Retrieved July 25, 2017.
- Wire, Sarah D. "A third challenger announces bid for Rep. Mimi Walters' Orange County seat". LA Times. Retrieved 18 June 2017.
- Lagos, Marisa. "Democratic Hopefuls Look to Unseat Republicans in 2018". KQED News. Retrieved 18 June 2017.
- Wasserman, Dave [@Redistrict] (November 14, 2018). "Projection: Katie Porter (D) has defeated Rep. Mimi Walters (R) in #CA45" (Tweet) – via Twitter.
- Statement of Vote (1990 Governor)
- Statement of Vote (1992 President)
- Statement of Vote (1992 Senate)
- Statement of Vote (1992 Senate)
- Statement of Vote (1994 Governor)
- Statement of Vote (1994 Senate)
- Statement of Vote (1996 President)
- Statement of Vote (1998 Governor) Archived September 29, 2011, at the Wayback Machine
- Statement of Vote (1998 Senate) Archived September 29, 2011, at the Wayback Machine
- Statement of Vote (2000 President)
- Statement of Vote (2000 Senator)
- Statement of Vote (2002 Governor)
- Statement of Vote (2003 Recall Question)
- Statement of Vote (2003 Governor)
- Statement of Vote (2004 President)
- Statement of Vote (2004 Senator)
- Statement of Vote (2006 Governor)
- Statement of Vote (2006 Senator)
- Statement of Vote (2008 President)
- Statement of Vote (2010 Governor)
- Statement of Vote (2010 Senator)
- Statement of Vote (2012 President)
- Statement of Vote (2012 Senator)
- Statement of Vote (2014 Governor)
- Statement of Vote (2016 President)
- Statement of Vote (2016 Senator)
- Statement of Vote (2018 Governor)
- Statement of Vote (2018 Senator)
- "Statement of Votes" (PDF). OCVote. Orange County Registrar of Voters. Retrieved 27 November 2020.
- 1982 election results
- 1984 election results
- 1986 election results
- 1988 election results
- 1990 election results
- 1992 election results
- 1994 election results
- 1996 election results
- 1998 election results
- 2000 election results
- 2002 election results
- 2004 election results
- 2006 election results
- 2008 election results
- 2010 election results
- 2012 election results
- 2014 election results
- 2016 election results
- 2018 election results