List of cities in Africa by population
The following is a list of the 100 largest cities in Africa by city proper population using the most recent official estimate. This reflects only cities located geographically in Africa including nearby islands.

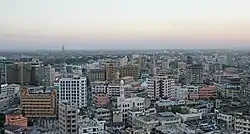
The largest city in Central Africa and second on the whole of the continent: Kinshasa, the capital of the Democratic Republic of the Congo.

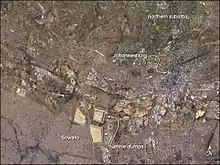
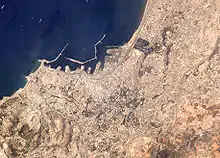
A space photograph showing the City of Johannesburg Metropolitan Municipality, the largest city and economic hub of South Africa and all of southern Africa.
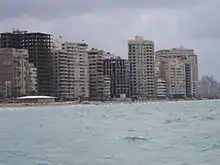
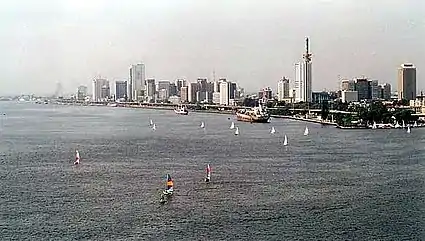
Seaside of Egypt's third largest city and ancient capital: Alexandria.

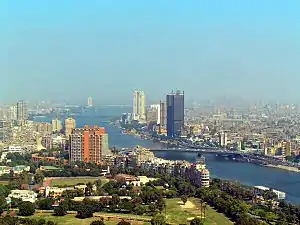
Skyline of Nairobi: the largest and capital city of Kenya, largest megalopolis in eastern Africa and the region's financial and economic capital.
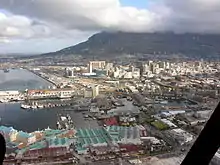
Cape Town, South Africa's second largest city as well as its legislative capital, and the southernmost city in Africa.
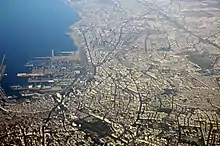
Aerial view of the extent of the Casablanca urban area, the largest in Morocco.
.jpg.webp)
List of city proper in Africa by population
Italics represents capital city
Bold represents largest city in country
| Rank | City | Country | Population | Date of estimate |
|---|---|---|---|---|
| 1 | Lagos | 14,862,000 | 2021 | |
| 2 | Kinshasa | 14,566,000 | 2020 | |
| 3 | Cairo | 9,908,788 | 2020 | |
| 4 | Giza | 8,800,000 | 2018 | |
| 5 | Johannesburg | 5,866,550 | 2020[1] | |
| 6 | Dar es Salaam | 5,550,000 | 2016 | |
| 7 | Alexandria | 5,200,000 | 2018 | |
| 8 | Abidjan | 4,980,000 | 2016 | |
| 9 | Nairobi | 4,720,000 | 2016 | |
| 10 | Cape Town | 4,604,986 | 2020[1] | |
| 11 | Casablanca | 4,370,000 | 2014 | |
| 12 | Accra | 4,200,000 | 2020 | |
| 13 | Ekurhuleni (East Rand) | 3,982,223 | 2020[1] | |
| 14 | Durban (eThekwini) | 3,981,205 | 2020[1] | |
| 15 | Tshwane (Pretoria) | 3,729,104 | 2020[1] | |
| 16 | Algiers | 3,420,000 | 2011 | |
| 17 | Kumasi | 3,206,000 | 2019 | |
| 18 | Tripoli | 3,072,000 | 2020 | |
| 19 | Addis Ababa | 3,040,000 | 2012 | |
| 20 | Kano | 2,830,000 | 2006 | |
| 21 | Luanda | 2,570,000 | 2019 | |
| 22 | Ibadan | 2,560,000 | 2006 | |
| 23 | Douala | 1,906,962 | 2005 | |
| 24 | Omdurman | 1,849,659 | 2008 | |
| 25 | Yaoundé | 1,817,524 | 2005 | |
| 26 | Bamako | 1,816,366 | 2009 | |
| 27 | Lusaka | 1,747,152 | 2010 | |
| 28 | Conakry | 1,660,973 | 2014 | |
| 29 | Mogadishu | 1,650,227 | 2014 | |
| 30 | Kampala | 1,650,800 | 2019 | |
| 31 | Mombasa | 1,500,000 | 2018 | |
| 32 | Harare | 1,485,231 | 2012 | |
| 33 | Lomé | 1,477,658 | 2010 | |
| 34 | Ouagadougou | 1,475,223 | 2006 | |
| 35 | Khartoum | 1,410,858 | 2008 | |
| 36 | Brazzaville | 1,373,382 | 2007 | |
| 37 | Antananarivo | 1,334,300 | 2014 | |
| 38 | Lubumbashi | 1,283,380 | 2004 | |
| 39 | Kisumu | 1,268,826 | 2018 | |
| 40 | Mbuji-Mayi | 1,213,726 | 2004 | |
| 41 | Port Elizabeth | 1,213,060 | 2020[1] | |
| 42 | Shubra el-Kheima | 1,187,747 | 2018 | |
| 43 | Dakar | 1,150,000 | 2013 | |
| 44 | Benin City | 1,147,188 | 2006 | |
| 45 | Kigali | 1,132,000 | 2020 | |
| 46 | Fez | 1,112,072 | 2014 | |
| 47 | Bujumbura | 1,112,057 | 2019 | |
| 48 | Freetown | 1,055,964 | 2015 | |
| 49 | Maputo | 1,032,197 | 2017 | |
| 50 | Monrovia | 1,021,762 | 2008 | |
| 51 | Khartoum North | 1,012,211 | 2008 | |
| 52 | Port Harcourt | 1,005,904 | 2006 | |
| 53 | Lilongwe | 989,318 | 2018 | |
| 54 | Niamey | 978,029 | 2012 | |
| 55 | Nouakchott | 958,399 | 2013 | |
| 56 | N'Djamena | 951,418 | 2009 | |
| 57 | Tangier | 947,952 | 2014 | |
| 58 | Marrakesh | 928,850 | 2014 | |
| 59 | Salé | 890,403 | 2014 | |
| 60 | Bukavu | 870,954 | 2016 | |
| 61 | Mangaung (Bloemfontein) | 870,920 | 2020[1] | |
| 62 | Jos | 821,608 | 2006 | |
| 63 | Oran | 803,329 | 2008 | |
| 64 | East London (eMonti) | 800,874 | 2020[1] | |
| 65 | Blantyre | 800,264 | 2018 | |
| 66 | Ilorin | 777,667 | 2006 | |
| 67 | Abuja | 776,298 | 2006 | |
| 68 | Asmara | 775,000 | 2014 | |
| 69 | Port Said | 760,152 | 2018 | |
| 70 | Kaduna | 760,084 | 2006 | |
| 71 | Touba | 753,315 | 2013 | |
| 72 | Hargeisa | 741,000 | 2014 | |
| 73 | Suez | 740,874 | 2018 | |
| 74 | Enugu | 722,664 | 2006 | |
| 75 | Kananga | 720,362 | 2004 | |
| 76 | Pointe-Noire | 715,334 | 2007 | |
| 77 | Mwanza | 706,453 | 2012 | |
| 78 | Libreville | 703,940 | 2013 | |
| 79 | Zaria | 695,089 | 2006 | |
| 80 | Kisangani | 682,599 | 2004 | |
| 81 | Cotonou | 679,012 | 2013 | |
| 82 | Nampula | 663,212 | 2017 | |
| 83 | Bulawayo | 653,337 | 2012 | |
| 84 | Tunis | 638,845 | 2014 | |
| 85 | Bangui | 622,771 | 2003 | |
| 86 | Beira | 592,090 | 2017 | |
| 87 | Rabat | 577,827 | 2014 | |
| 88 | Kolwezi | 572,942 | 2015 | |
| 89 | El Mansoura | 570,271 | 2018 | |
| 90 | Benghazi [2] | 562,067 | 2012 | |
| 91 | Warri | 557,398 | 2006 | |
| 92 | El Mahalla el-Kubra | 543,271 | 2018 | |
| 93 | Maiduguri | 543,016 | 2006 | |
| 94 | Bouaké | 536,719 | 2014 | |
| 95 | Ikorodu | 535,619 | 2006 | |
| 96 | Aba | 534,265 | 2006 | |
| 97 | Tanta | 528,670 | 2018 | |
| 98 | Meknes | 520,428 | 2014 | |
| 99 | Ife | 509,035 | 2006 | |
| 100 | Zanzibar City | 501,459 | 2012 |
References
- "P0302 - Mid-year population estimates, 2020". Stats SA. Statistics South Africa. 9 July 2020. p. District Council projection by sex and age (2002-2020). Retrieved 5 February 2021.
- Last census was in 1984. 2012 unofficial estimate.
This article is issued from Wikipedia. The text is licensed under Creative Commons - Attribution - Sharealike. Additional terms may apply for the media files.