MTR (software)
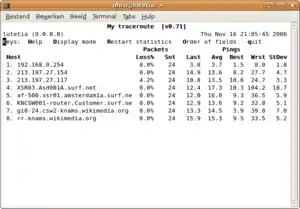
My traceroute, originally named Matt's traceroute (MTR), is a computer program which combines the functions of the traceroute and ping programs in one network diagnostic tool.[2]
 | |
| Developer(s) | BitWizard |
|---|---|
| Initial release | 1997 |
| Stable release | 0.93
/ August 3, 2019[1] |
| Repository | |
| Written in | C |
| Operating system | Unix-like |
| Type | Network |
| License | GNU General Public License Version 2 |
| Website | www |
| Original author(s) | Appnor MSP S.R.L. |
|---|---|
| Developer(s) | White-Tiger |
| Stable release | 1.00
/ January 12, 2014 |
| Repository | github |
| Written in | C++ |
| Operating system | Windows |
| Type | Network |
| License | GNU General Public License Version 2 |
| Website | github |
MTR probes routers on the route path by limiting the number of hops individual packets may traverse, and listening to responses of their expiry. It will regularly repeat this process, usually once per second, and keep track of the response times of the hops along the path.
History
The original Matt's traceroute program was written by Matt Kimball in 1997. Roger Wolff took over maintaining MTR (renamed My traceroute) in October 1998.[3]
Fundamentals
MTR is licensed under the terms of the GNU General Public License (GPL) and works under modern Unix-like operating systems. It normally works under the text console, but it also has an optional GTK+-based graphical user interface (GUI).
MTR relies on Internet Control Message Protocol (ICMP) Time Exceeded (type 11, code 0) packets coming back from routers, or ICMP Echo Reply packets when the packets have hit their destination host. MTR also has a User Datagram Protocol (UDP) mode (invoked with "-u" on the command line or pressing the "u" key in the curses interface) that sends UDP packets, with the time to live (TTL) field in the IP header increasing by one for each probe sent, toward the destination host. When the UDP mode is used, MTR relies on ICMP port unreachable packets (type 3, code 3) when the destination is reached.
MTR also supports IPv6 and works in a similar manner but instead relies on ICMPv6 messages.
The tool is often used for network troubleshooting. By showing a list of routers traversed, and the average round-trip time as well as packet loss to each router, it allows users to identify links between two given routers responsible for certain fractions of the overall latency or packet loss through the network.[4] This can help identify network overuse problems.[5]
Examples
This example shows MTR running on Linux tracing a route from the host machine (example.lan) to a web server at Yahoo! (p25.www.re2.yahoo.com) across the Level 3 Communications network.
                             My traceroute  [v0.71]
            example.lan                           Sun Mar 25 00:07:50 2007

                                       Packets                Pings
Hostname                            %Loss  Rcv  Snt  Last Best  Avg  Worst
 1. example.lan                        0%   11   11     1    1    1      2
 2. ae-31-51.ebr1.Chicago1.Level3.n   19%    9   11     3    1    7     14
 3. ae-1.ebr2.Chicago1.Level3.net      0%   11   11     7    1    7     14
 4. ae-2.ebr2.Washington1.Level3.ne   19%    9   11    19   18   23     31
 5. ae-1.ebr1.Washington1.Level3.ne   28%    8   11    22   18   24     30
 6. ge-3-0-0-53.gar1.Washington1.Le    0%   11   11    18   18   20     36
 7. 63.210.29.230                      0%   10   10    19   19   19     19
 8. t-3-1.bas1.re2.yahoo.com           0%   10   10    19   18   32    106
 9. p25.www.re2.yahoo.com              0%   10   10    19   18   19     19
An additional example below shows a recent version of MTR running on FreeBSD. MPLS labels are displayed by default when the "-e" switch is used on the command line (or the "e" key is pressed in the curses interface):
                                  My traceroute  [v0.82]
dax.prolixium.com (0.0.0.0)                                      Sun Jan  1 12:58:02 2012
Keys:  Help   Display mode   Restart statistics   Order of fields   quit
                                                 Packets               Pings
 Host                                          Loss%   Snt   Last   Avg  Best  Wrst StDev
 1. voxel.prolixium.net                         0.0%    13    0.4   1.7   0.4  10.4   3.2
 2. 0.ae2.tsr1.lga5.us.voxel.net                0.0%    12   10.8   2.9   0.2  10.8   4.3
 3. 0.ae59.tsr1.lga3.us.voxel.net               0.0%    12    0.4   1.7   0.4  16.0   4.5
 4. rtr.loss.net.internet2.edu                  0.0%    12    4.8   7.4   0.3  41.8  15.4
 5. 64.57.21.210                                0.0%    12    5.4  15.7   5.3 126.7  35.0
 6. nox1sumgw1-vl-530-nox-mit.nox.org           0.0%    12  109.5  60.6  23.0 219.5  66.0
    [MPLS: Lbl 172832 Exp 0 S 1 TTL 1]
 7. nox1sumgw1-peer--207-210-142-234.nox.org    0.0%    12   25.0  23.2  23.0  25.0   0.6
 8. B24-RTR-2-BACKBONE-2.MIT.EDU                0.0%    12   23.2  23.4  23.2  24.9   0.5
 9. MITNET.TRANTOR.CSAIL.MIT.EDU                0.0%    12   23.4  23.4  23.3  23.5   0.1
10. trantor.helicon.csail.mit.edu               0.0%    12   23.7  25.0  23.5  26.5   1.3
11. zermatt.csail.mit.edu                       0.0%    12   23.1  23.1  23.1  23.3   0.1
Windows versions
WinMTR is a Windows GUI application functionally equivalent to MTR. It was originally developed by Appnor MSP S.R.L.; it is now maintained by White-Tiger. Although it is very similar, WinMTR shares no common code with MTR.
A console version of MTR does exist for Windows, but it has fewer features than MTR on other platforms.[6]
See also
- traceroute
- Ping (networking utility)
- PathPing - a network utility supplied in Windows NT and beyond that combines the functions of ping with those of traceroute, or tracert
- Bufferbloat
References
- "Releases - traviscross/mtr". Retrieved 6 Aug 2019 – via GitHub.
- Upstream Provider Woes? Point the Ping of Blame. (linuxplanet.com)
- Cisco router configuration and troubleshooting By Mark Tripod (Google Books)
- Nore, Haakon Løchen (2014). "Understanding network performance bottlenecks". Institutt for telematikk.
- Linode: Diagnosing Network Issues with MTR
- Based on: https://github.com/traviscross/mtr/issues/55#issuecomment-264057403
External links
- Official website
- MTR manual page
- MTR, BitWizard's MTR page with Unix downloads
- WinMTR, the equivalent of MTR for Windows platforms
- WinMTR (Redux), fork of WinMTR, maintained by René Schümann aka White-Tiger