Opinion polling for the next Estonian parliamentary election
In the run up to the next Estonian parliamentary election, various organisations carry out opinion polling to gauge voting intention in Estonia. Results of such polls are displayed in this article.
The date range for these opinion polls are from the previous general election, held on 3 March 2019.
Poll results are listed in the table below in reverse chronological order, showing the most recent first. The highest percentage figure in each poll is displayed in bold, and the background shaded in the leading party's color. In the instance that there is a tie, then no figure is shaded.
Graphical summary
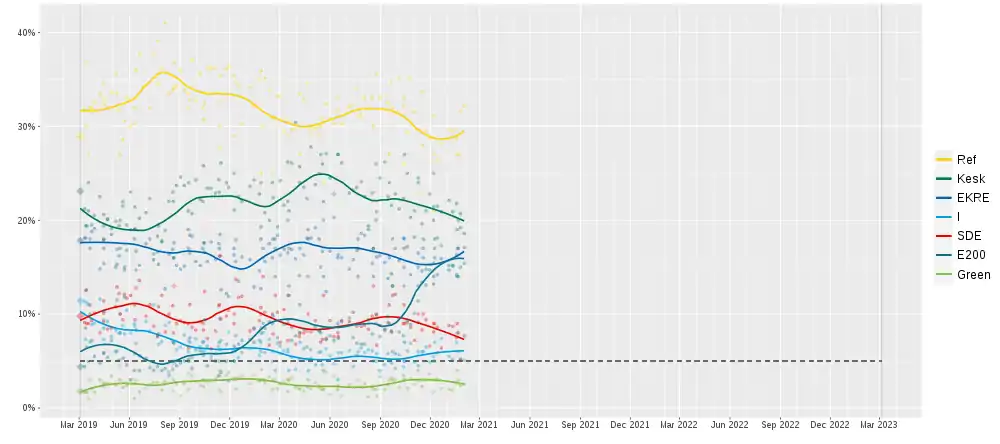
Polling results
2021
| Polling firm | Fieldwork Date | Sample size |
Ref | Kesk | EKRE | I | SDE | E200 | Green | Others | Lead | Gov. | Opp. |
|---|---|---|---|---|---|---|---|---|---|---|---|---|---|
| Norstat | 26 Jan–1 Feb | ≥1,000 | 32.3 | 18.6 | 17.1 | 5.1 | 7.7 | 15.4 | 2.5 | 1.3 | 13.7 | 50.9 | 47.8 |
| Kaja Kallas' cabinet is formed by the Reform Party and Centre Party | |||||||||||||
| Norstat | 18–25 Jan | ≥1,000 | 31.6 | 20.7 | 19.2 | 5.2 | 5.1 | 15.0 | 2.4 | 0.8 | 10.9 | 45.1 | 54.1 |
| Turu-uuringute AS | 12–21 Jan | 1008 | 27 | 20 | 17 | 6 | 8 | 14 | 3 | 5 | 7 | 43 | 57 |
| Norstat | 12–18 Jan | ≥1,000 | 28.7 | 21.8 | 16.3 | 7.0 | 7.5 | 14.2 | 2.7 | 1.8 | 6.9 | 45.1 | 53.1 |
| Kantar Emor | 14–19 Jan | 1,219 | 27 | 19 | 14 | 8 | 9 | 17 | 4 | 1 | 8 | 41 | 58 |
| Jüri Ratas' second cabinet is dissolved | |||||||||||||
| Norstat | 05–11 Jan | ≥1,000 | 29.5 | 20.9 | 15.1 | 5.2 | 8.7 | 15.2 | 1.9 | 3.5 | 8.6 | 41.2 | 55.3 |
| Norstat | 29 Dec–04 Jan | ≥1,000 | 29.6 | 22.1 | 14.7 | 5.5 | 8.8 | 15.2 | 2.0 | 2.1 | 7.5 | 42.3 | 55.6 |
2020
| Polling firm | Fieldwork Date | Sample size |
Ref | Kesk | EKRE | I | SDE | E200 | Green | TULE | Others | Lead | Gov. | Opp. |
|---|---|---|---|---|---|---|---|---|---|---|---|---|---|---|
| Norstat | 16–21 Dec | ≥1,000 | 28.1 | 20.9 | 15.9 | 7.4 | 6.4 | 17.3 | 2.1 | — | 1.9 | 7.2 | 44.2 | 53.9 |
| Norstat | 09–14 Dec | ≥1,000 | 26.4 | 21.5 | 14.2 | 5.9 | 8.6 | 18.1 | 3.1 | — | 2.2 | 4.9 | 41.6 | 56.2 |
| Kantar Emor | 03–09 Dec | 1,151 | 27 | 16 | 17 | 7 | 9 | 18 | 5 | 1 | — | 9 | 40 | 60 |
| Norstat | 1–7 Dec | ≥1,000 | 31.2 | 21.4 | 13.2 | 5.5 | 8.1 | 15.4 | 1.7 | — | 3.5 | 9.8 | 40.1 | 59.9 |
| Turu-uuringute AS | 27 Nov–7 Dec | 881 | 21 | 25 | 14 | 5 | 9 | 20 | 3 | 1 | 2 | 4 | 44 | 54 |
| Norstat | 24–30 Nov | ≥1,000 | 28.8 | 22.8 | 14.7 | 4.9 | 6.6 | 15.3 | 3.6 | 1.1 | 2.2 | 6.0 | 42.4 | 55.4 |
| Norstat | 17–23 Nov | ≥1,000 | 29.6 | 21.0 | 13.1 | 6.5 | 9.4 | 14.8 | 3.0 | 0.4 | 2.2 | 8.6 | 40.6 | 57.2 |
| Kantar Emor | 13–18 Nov | 1,281 | 28 | 17 | 16 | 6 | 10 | 18 | 3 | 2 | — | 10 | 39 | 61 |
| Norstat | 11–16 Nov | ≥1,000 | 33.7 | 19.6 | 14.6 | 6.0 | 8.3 | 13.4 | 2.3 | 0.6 | 1.5 | 14.1 | 40.2 | 58.3 |
| Norstat | 3–9 Nov | ≥1,000 | 29.7 | 24.5 | 16.5 | 4.5 | 9.1 | 11.4 | 2.9 | 0.4 | 1.0 | 5.2 | 45.5 | 53.5 |
| Turu-uuringute AS | 30 Oct–9 Nov | 854 | 23 | 24 | 15 | 6 | 10 | 13 | 4 | 1 | 4 | 1 | 45 | 51 |
| Norstat | 27 Oct–2 Nov | ≥1,000 | 31.5 | 21.0 | 18.2 | 4.9 | 7.2 | 10.1 | 2.5 | 0.3 | 4.3 | 10.5 | 44.1 | 51.6 |
| Norstat | 22–26 Oct | ≥1,000 | 35.1 | 20.3 | 14.2 | 6.9 | 8.6 | 8.9 | 3.1 | 0.6 | 2.3 | 14.8 | 41.4 | 56.3 |
| Norstat | 14–20 Oct | ≥1,000 | 29.4 | 25.0 | 17.2 | 6.1 | 9.1 | 9.3 | 2.1 | 0.6 | 1.2 | 4.4 | 48.3 | 50.5 |
| Turu-uuringute AS | 1–15 Oct | 873 | 26 | 27 | 18 | 5 | 9 | 7 | 3 | 1 | 4 | 1 | 50 | 45 |
| Kantar Emor | 8–14 Oct | 1,268 | 33 | 17 | 15 | 5 | 11 | 13 | 3 | 2 | 1 | 16 | 37 | 62 |
| Norstat | 6–13 Oct | ≥1,000 | 32.2 | 22.3 | 18.1 | 4.4 | 9.0 | 7.7 | 3.5 | 0.6 | 2.2 | 9.9 | 44.8 | 53.0 |
| Norstat | 28 Sep–05 Oct | ≥1,000 | 35.1 | 21.2 | 15.7 | 5.7 | 9.6 | 8.1 | 2.2 | 1.4 | 1.0 | 13.9 | 42.6 | 56.4 |
| Norstat | 23–28 Sep | ≥1,000 | 31.4 | 22.8 | 17.0 | 4.2 | 12.1 | 5.8 | 3.0 | 0.5 | 3.3 | 8.6 | 44 | 52.7 |
| Kantar Emor | 17–23 Sep | 1,089 | 32 | 18 | 13 | 6 | 12 | 13 | 3 | 2 | 1 | 14 | 37 | 62 |
| Norstat | 15–21 Sep | ≥1,000 | 34.7 | 21.6 | 14.3 | 4.8 | 8.2 | 8.1 | 3.2 | 1.4 | 3.7 | 13.1 | 40.7 | 55.6 |
| Turu-uuringute AS | 07–17 Sep | 1,010 | 27 | 24 | 16 | 5 | 11 | 9 | 3 | 3 | — | 3 | 45 | 55 |
| Norstat | 9–15 Sep | ≥1,000 | 32.5 | 22.5 | 13.8 | 5.8 | 9.1 | 9.7 | 2.5 | 1.4 | 2.7 | 10.0 | 42.1 | 55.2 |
| Norstat | 2–9 Sep | ≥1,000 | 33.3 | 26.2 | 15.5 | 4.6 | 8.3 | 8.4 | 2.0 | 0.8 | 0.9 | 7.1 | 46.3 | 52.8 |
| Norstat | 25–31 Aug | ≥1,000 | 33.0 | 24.5 | 16.2 | 4.0 | 8.8 | 7.6 | 3.3 | 1.2 | 1.4 | 8.5 | 44.7 | 53.9 |
| The Biodiversity Party and the Estonian Free Party merge to form the Estonian Party of the Future | ||||||||||||||
| Polling firm | Fieldwork Date | Sample size |
Ref | Kesk | EKRE | I | SDE | E200 | Green | EVA | Others | Lead | Gov. | Opp. |
| Norstat | 17–25 Aug | ≥1,000 | 35.5 | 20.9 | 16.1 | 5.8 | 6.7 | 9.9 | 1.3 | 0.7 | 3.1 | 14.6 | 42.8 | 54.1 |
| Turu-uuringute AS | 12–24 Aug | 1,003 | 23 | 26 | 20 | 5 | 10 | 9 | 2 | 0 | 1 | 3 | 51 | 48 |
| Kantar Emor | 13–19 Aug | 1,268 | 30 | 17 | 17 | 5 | 13 | 14 | 2 | 1 | 3 | 13 | 39 | 58 |
| Norstat | 10–17 Aug | ≥1,000 | 33.0 | 22.9 | 15.4 | 6.1 | 9.8 | 7.9 | 2.3 | 0.6 | 2.0 | 7.1 | 44.4 | 53.6 |
| Norstat | 4–10 Aug | ≥1,000 | 32.1 | 19.4 | 19.0 | 6.2 | 8.4 | 9.4 | 1.2 | 1.1 | 3.2 | 12.7 | 44.6 | 52.2 |
| Norstat | 27 Jul–3 Aug | ≥1,000 | 33.0 | 22.5 | 18.4 | 5.9 | 8.8 | 6.8 | 2.6 | 0.9 | 1.1 | 10.5 | 46.8 | 52.1 |
| Norstat | 21–28 Jul | ≥1,000 | 31.2 | 24.1 | 18.6 | 6.4 | 8.7 | 6.8 | 2.2 | 0.6 | 1.4 | 7.1 | 49.1 | 49.5 |
| Kantar Emor | 16–22 Jul | 1,125 | 31 | 17 | 18 | 6 | 9 | 14 | 3 | 0 | 2 | 13 | 41 | 57 |
| Norstat | 14–20 Jul | ≥1,000 | 34.0 | 23.5 | 16.8 | 5.6 | 8.7 | 6.9 | 2.3 | 0.3 | 1.9 | 10.5 | 45.9 | 52.2 |
| Norstat | 7–13 Jul | ≥1,000 | 32.3 | 23.2 | 15.8 | 4.4 | 10.2 | 7.5 | 2.2 | 0.4 | 4.0 | 9.1 | 43.4 | 52.6 |
| Norstat | 29 Jun–06 Jul | ≥1,000 | 32.1 | 22.9 | 14.8 | 6.1 | 9.2 | 9.6 | 2.5 | 0.6 | 2.2 | 9.2 | 43.8 | 54 |
| Norstat | 16–22 Jun | ≥1,000 | 30.3 | 26.1 | 16.0 | 5.9 | 9.3 | 9.2 | 1.3 | 0.9 | 1.2 | 4.2 | 48 | 51 |
| Norstat | 9–16 Jun | ≥1,000 | 31.7 | 27.0 | 16.3 | 5.9 | 7.6 | 7.4 | 2.4 | 0.4 | 1.3 | 4.7 | 49.2 | 49.5 |
| Turu-uuringute AS | 9–15 Jun | 1,004 | 33 | 27 | 16 | 3 | 8 | 9 | 2 | 0 | 1 | 6 | 46 | 55 |
| Kantar Emor | Jun | 1,268 | 28 | 19 | 19 | 5 | 10 | 13 | 3 | 0 | 3 | 9 | 43 | 54 |
| Norstat | 1–8 Jun | ≥1,000 | 30.3 | 22.8 | 20.3 | 4.7 | 7.6 | 7.2 | 3.4 | 0.4 | 3.3 | 7.5 | 47.8 | 48.9 |
| Norstat | 25 May–1 Jun | ≥1,000 | 30.8 | 24.5 | 16.7 | 5.6 | 9.3 | 7.7 | 1.4 | 0.3 | 3.7 | 6.3 | 46.8 | 49.5 |
| Norstat | 18–25 May | ≥1,000 | 32.4 | 27.1 | 12.4 | 6.3 | 7.4 | 7.3 | 3.8 | 0.4 | 2.9 | 5.3 | 45.8 | 51.3 |
| Kantar Emor | 14–20 May | 1,268 | 24 | 20 | 22 | 4 | 12 | 14 | 2 | 0 | 2 | 2 | 46 | 52 |
| Norstat | 12–18 May | ≥1,000 | 30.8 | 26.0 | 16.7 | 4.6 | 7.3 | 8.5 | 2.0 | 1.1 | 3.0 | 4.8 | 47.3 | 49.7 |
| Turu-uuringute AS | 7–15 May | 1,004 | 30 | 27 | 15 | 6 | 7 | 8 | 2 | 0 | 1 | 3 | 48 | 51 |
| Norstat | 06–12 May | ≥1,000 | 29.1 | 25.0 | 18.0 | 5.9 | 8.3 | 8.2 | 2.3 | 0.2 | 3.8 | 4.1 | 48.9 | 48.3 |
| Norstat | 24 Apr–05 May | ≥1,000 | 29.8 | 23.8 | 19.2 | 4.6 | 9.3 | 8.6 | 2.7 | 0.8 | 1.2 | 6.0 | 47.6 | 51.2 |
| Norstat | 21–27 Apr | ≥1,000 | 29.3 | 27.8 | 18.1 | 5.3 | 8.1 | 6.2 | 2.1 | 0.7 | 3.0 | 1.5 | 51.2 | 45.8 |
| Kantar Emor | 20–22 Apr | 1,280 | 30 | 18 | 19 | 4 | 10 | 14 | 3 | 2 | 3 | 12 | 42 | 55 |
| Norstat | 15–20 Apr | ≥1,000 | 34.6 | 22.3 | 18.1 | 5.2 | 8.2 | 6.5 | 2.3 | 0.2 | 2.4 | 12.3 | 45.6 | 52.0 |
| Norstat | 7–14 Apr | ≥1,000 | 32.9 | 23.5 | 16.3 | 6.3 | 8.0 | 8.4 | 1.8 | 0.4 | 2.4 | 9.4 | 46.1 | 51.5 |
| Turu-uuringute AS | 6–7 Apr | 1,000 | 27 | 24 | 17 | 7 | 8 | 11 | 2 | 1 | 3 | 3 | 48 | 49 |
| Norstat | 31 Mar–6 Apr | ≥1,000 | 33.5 | 25.7 | 14.1 | 5.1 | 7.6 | 8.0 | 2.1 | 0.7 | 3.2 | 7.8 | 44.9 | 51.9 |
| Norstat | 24–30 Mar | ≥1,000 | 29.7 | 30.4 | 15.9 | 4.1 | 6.8 | 7.7 | 2.2 | 0.5 | 2.7 | 0.7 | 50.4 | 46.9 |
| Norstat | 18–23 Mar | ≥1,000 | 29.6 | 26.1 | 16.9 | 5.4 | 8.6 | 7.2 | 3.2 | 0.3 | 2.7 | 3.5 | 48.4 | 48.9 |
| Kantar Emor | 12–18 Mar | 1,118 | 29 | 17 | 21 | 4 | 12 | 13 | 3 | − | 2 | 8 | 42 | 56 |
| Norstat | 10–16 Mar | ≥1,000 | 30.7 | 26.2 | 16.5 | 6.3 | 7.2 | 9.4 | 1.8 | 0.2 | 1.7 | 4.5 | 49.0 | 49.7 |
| Turu-uuringute AS | 6–16 Mar | 1,056 | 26 | 22 | 20 | 6 | 9 | 12 | 3 | 1 | 1 | 4 | 48 | 51 |
| Norstat | 04–9 Mar | ≥1,000 | 29.5 | 21.6 | 16.9 | 6.1 | 10.5 | 8.9 | 2.8 | 0.5 | 3.2 | 7.9 | 44.6 | 52.2 |
| Norstat | 26 Feb–2 Mar | ≥1,000 | 33.2 | 24.2 | 16.3 | 5.8 | 7.0 | 6.6 | 2.5 | 0.7 | 3.3 | 9.0 | 46.3 | 50.4 |
| Norstat | 19–26 Feb | ≥1,000 | 33.2 | 19.3 | 18.4 | 6.9 | 10.2 | 7.5 | 2.1 | 0.5 | 1.9 | 13.9 | 44.6 | 53.5 |
| Kantar Emor | 1–22 Feb | — | 31 | 18 | 17 | 4 | 12 | 14 | 3 | − | 1 | 13 | 39 | 60 |
| Norstat | 13–18 Feb | ≥1,000 | 30.9 | 22.4 | 18.0 | 6.0 | 7.9 | 9.8 | 3.0 | 0.7 | 1.3 | 8.5 | 46.4 | 52.3 |
| Turu-uuringute AS | 6–17 Feb | 808 | 25 | 24 | 16 | 5 | 10 | 9 | 2 | − | 1 | 1 | 45 | 54 |
| Norstat | 04–11 Feb | ≥1,000 | 33.8 | 20.0 | 17.5 | 7.3 | 6.7 | 9.2 | 3.3 | 0.5 | 1.8 | 13.8 | 44.8 | 53.4 |
| Norstat | 28 Jan–3 Feb | ≥1,000 | 35.1 | 20.8 | 15.6 | 5.9 | 10.2 | 8.5 | 2.7 | 0.3 | 1.0 | 14.3 | 42.3 | 56.7 |
| Norstat | 23–27 Jan | ≥1,000 | 35.9 | 19.3 | 12.7 | 6.0 | 10.7 | 8.5 | 4.1 | 0.4 | 2.4 | 16.6 | 38.0 | 59.6 |
| Kantar Emor | 1–31 Jan | — | 30 | 17 | 16 | 8 | 14 | 9 | 3 | 1 | 2 | 13 | 41 | 57 |
| Turu-uuringute AS | 17–27 Jan | 808 | 25 | 24 | 18 | 7 | 10 | 8 | 3 | 1 | 1 | 1 | 49 | 50 |
| Norstat | 16–24 Jan | ≥1,000 | 35.0 | 22.8 | 14.6 | 5.6 | 9.3 | 7.2 | 2.9 | 1.1 | 1.4 | 12.2 | 43.0 | 55.6 |
| Norstat | 8–14 Jan | ≥1,000 | 32.2 | 24.3 | 12.9 | 8.4 | 8.5 | 7.0 | 3.5 | 0.6 | 2.2 | 7.9 | 45.6 | 52.2 |
| Norstat | 3–7 Jan | ≥1,000 | 34.1 | 23.6 | 15.8 | 6.3 | 8.2 | 7.3 | 2.6 | 0.6 | 1.5 | 10.5 | 45.7 | 52.8 |
2019
| Polling firm | Fieldwork Date | Sample size |
Ref | Kesk | EKRE | I | SDE | E200 | Green | EVA | Others | Lead | Gov. | Opp. |
|---|---|---|---|---|---|---|---|---|---|---|---|---|---|---|
| Norstat | 18–23 Dec | ≥1,000 | 30.3 | 22.0 | 16.1 | 5.9 | 11.9 | 7.2 | 3.4 | 0.9 | 2.4 | 8.3 | 44.0 | 53.6 |
| Norstat | 11–17 Dec | ≥1,000 | 34.3 | 22.5 | 13.5 | 5.4 | 11.8 | 6.8 | 3.2 | 0.1 | 2.4 | 11.8 | 41.4 | 56.2 |
| Kantar Emor | 5–12 Dec | 1,407 | 34.8 | 17.9 | 15.6 | 6.3 | 13.7 | 7.7 | 2 | — | 2 | 9.2 | 39.8 | 58.2 |
| Norstat | 2–9 Dec | ≥1,000 | 35.4 | 21.1 | 16.3 | 6.0 | 9.0 | 6.6 | 3.2 | 0.4 | 1.9 | 14.3 | 43.4 | 54.7 |
| Turu-uuringute AS | 28 Nov–9 Dec | 1,014 | 29 | 25 | 17 | 5 | 10 | 5 | 3 | 1 | 5 | 4 | 47 | 48 |
| Norstat | 25–29 Nov | ≥1,000 | 36.4 | 23.5 | 11.9 | 8.1 | 10.4 | 2.9 | 3.8 | 0.5 | 2.3 | 12.9 | 43.5 | 53.6 |
| Norstat | 18–25 Nov | ≥1,000 | 36.1 | 24.0 | 12.2 | 6.8 | 9.8 | 5.0 | 3.5 | 0.5 | 2.1 | 12.1 | 43.0 | 54.9 |
| Norstat | 11–15 Nov | ≥1,000 | 35.4 | 26.1 | 12.6 | 7.2 | 9.5 | 3.8 | 1.7 | 0.1 | 3.8 | 9.3 | 45.9 | 50.3 |
| Kantar Emor | 7–13 Nov | 1,407 | 27.7 | 16.2 | 18.5 | 6.2 | 16.2 | 9.5 | 4 | 1 | 1.7 | 9.2 | 40.9 | 57.4 |
| Turu-uuringute AS | 31 Oct–12 Nov | 1,019 | 30 | 23 | 17 | 5 | 11 | 7 | 2 | 1 | 1 | 7 | 45.0 | 54 |
| Norstat | 5–11 Nov | ≥1,000 | 32.6 | 24.3 | 17.5 | 6.5 | 10.9 | 3.4 | 3.5 | 0.2 | 1.0 | 8.3 | 48.3 | 50.7 |
| Norstat | 28 Oct–5 Nov | ≥1,000 | 36.2 | 22.9 | 15.8 | 5.8 | 8.2 | 5.0 | 3.2 | 0.8 | 1.8 | 13.3 | 44.5 | 53.7 |
| Norstat | 22–28 Oct | ≥1,000 | 36.1 | 23.4 | 17.7 | 5.5 | 6.3 | 5.1 | 2.9 | 0.6 | 2.0 | 12.7 | 46.6 | 51.4 |
| Norstat | 15–21 Oct | ≥1,000 | 36.3 | 23.4 | 15.6 | 6.6 | 7.4 | 4.5 | 2.7 | 0.3 | 2.9 | 14.9 | 45.6 | 51.5 |
| Kantar Emor | 10–16 Oct | 1,182 | 32.5 | 17.6 | 16.6 | 6.2 | 12.4 | 9.4 | 2.9 | — | 1.7 | 14.9 | 40.4 | 57.9 |
| Norstat | 9–14 Oct | ≥1,000 | 30.7 | 25.8 | 17.6 | 7.1 | 8.3 | 5,6 | 2.3 | 0.4 | 1.4 | 4.9 | 50.5 | 48.1 |
| Turu-uuringute AS | 3–13 Oct | 1,040 | 32 | 22 | 17 | 6 | 9 | 7 | 3 | 1 | — | 10 | 45.0 | 54.0 |
| Norstat | 1–8 Oct | ≥1,000 | 35.6 | 22.2 | 15.2 | 6.5 | 9.2 | 6.1 | 2.4 | 0.6 | 2.1 | 13.4 | 43.9 | 54.0 |
| Norstat | 25–30 Sep | ≥1,000 | 32.7 | 24.3 | 15.6 | 7.4 | 8.3 | 6.2 | 2.8 | 0.6 | 2.1 | 8.4 | 47.3 | 50.6 |
| Norstat | 18–23 Sep | ≥1,000 | 37.1 | 20.7 | 18.3 | 5.4 | 8.6 | 4.2 | 3.4 | 0.6 | 1.8 | 17.0 | 44.4 | 53.8 |
| Kantar Emor | 11–19 Sep | 1,161 | 32.8 | 16.5 | 18.4 | 7.0 | 11.0 | 7.5 | 5 | — | 1 | 14.4 | 41.9 | 57.5 |
| Norstat | 10–17 Sep | ≥1,000 | 33.5 | 24.0 | 17.0 | 7.2 | 6.4 | 5.2 | 3.7 | 0.1 | 2.3 | 13.5 | 48.2 | 49.5 |
| Turu-uuringute AS | 5–16 Sep | 1,040 | 32 | 21 | 19 | 6 | 9 | 5 | 2 | 1 | 1 | 11 | 45.0 | 53.0 |
| Norstat | 3–9 Sep | ≥1,000 | 33.9 | 23.7 | 15.1 | 7.8 | 9.1 | 5.0 | 2.6 | 0.6 | 2.1 | 10.2 | 46.6 | 50.8 |
| Norstat | 27 Aug–2 Sep | ≥1,000 | 35.9 | 24.6 | 14.8 | 6.5 | 9.3 | 4.8 | 1.3 | 0.2 | 2.6 | 11.3 | 45.9 | 51.5 |
| Norstat | 21–26 Aug | ≥1,000 | 34.3 | 23.7 | 15.2 | 6.2 | 9.0 | 4.5 | 2.6 | 0.8 | 3.6 | 10.6 | 45.1 | 51.3 |
| Kantar Emor | 15–21 Aug | 1,161 | 36.8 | 16.0 | 17.6 | 4.8 | 13.0 | 6.9 | — | — | — | 19.2 | 43.3 | 56.7 |
| Turu-uuringute AS | 9–20 Aug | 1,000 | 34 | 22 | 16 | 7 | 8 | 5 | 3 | 1 | 1 | 12 | 45.0 | 54.0 |
| Norstat | 13–19 Aug | ≥1,000 | 33.9 | 23.0 | 16.9 | 7.1 | 10.9 | 4.1 | 1.8 | 0.7 | 1.7 | 10.9 | 47.0 | 51.7 |
| Norstat | 5–12 Aug | ≥1,000 | 33.5 | 22.0 | 16.4 | 9.1 | 10.0 | 3.5 | 3.9 | 0.3 | 1.1 | 11.5 | 47.5 | 51.2 |
| Norstat | 30 Jul–5 Aug | ≥1,000 | 41.0 | 18.9 | 12.7 | 8.8 | 8.1 | 4.2 | 2.8 | 0.8 | 3.0 | 22.1 | 40.1 | 56.9 |
| Norstat | 22–30 Jul | ≥1,000 | 36.2 | 17.8 | 17.7 | 7.1 | 12.0 | 4.0 | 1.9 | 0.6 | 2.6 | 18.4 | 42.6 | 54.8 |
| Kantar Emor | 18–24 Jul | 1,305 | 34.5 | 15.3 | 19.4 | 6.8 | 10.8 | 7.9 | — | — | — | 15.1 | 41.5 | 53.2 |
| Norstat | 15–22 Jul | ≥1,000 | 39.1 | 18.3 | 16.6 | 7.7 | 7.6 | 4.4 | 2.7 | 0.2 | 3.6 | 20.8 | 42.6 | 54.0 |
| Norstat | 8–15 Jul | ≥1,000 | 37.7 | 16.4 | 15.8 | 11.0 | 8.7 | 4.0 | 2.7 | 1.1 | 2.7 | 21.3 | 43.2 | 54.2 |
| Norstat | 2–8 Jul | ≥1,000 | 31.9 | 22.3 | 18.0 | 8.2 | 11.0 | 4.3 | 2.5 | 0.9 | 1.0 | 9.6 | 48.5 | 50.6 |
| Norstat | 26 Jun–1 Jul | ≥1,000 | 34.3 | 20.8 | 17.5 | 9.2 | 9.8 | 5.3 | 2.1 | 0.2 | 0.7 | 13.5 | 47.5 | 51.7 |
| Norstat | 11–19 Jun | ≥1,000 | 37.7 | 20.2 | 15.2 | 5.6 | 13.6 | 4.0 | 1.7 | 0.3 | 1.6 | 17.5 | 41.0 | 57.3 |
| Kantar Emor | 6–13 Jun | 1,129 | 36.0 | 14.7 | 16.7 | 6.9 | 12.8 | 8.3 | 3.0 | 0 | 1.0 | 19.3 | 38.3 | 60.1 |
| Norstat | 4–11 Jun | ≥1,000 | 30.3 | 21.4 | 19.1 | 8.7 | 9.4 | 5.8 | 2.6 | 1.4 | 1.0 | 8.9 | 49.2 | 49.5 |
| Turu-uuringute AS | 28 May–10 Jun | 1,000 | 32 | 19 | 18 | 9 | 11 | 4 | 1 | 1 | 1 | 13 | 46 | 49 |
| Norstat | 27 May–3 Jun | ≥1,000 | 30 | 23 | 19 | 8 | 12 | 3 | 3 | 0 | 1 | 7 | 50 | 48 |
| Norstat | 20–27 May | ≥1,000 | 33.0 | 19.5 | 16.8 | 10.4 | 11.7 | 4.6 | 2.4 | 0.4 | 1.1 | 13.5 | 46.7 | 52.1 |
| 2019 European Parliament election in Estonia | ||||||||||||||
| Kantar Emor | 20–23 May | 1,390 | 30.6 | 14.7 | 15.0 | 7.9 | 12.1 | 11.8 | — | — | — | 15.6 | 37.6 | 54.4 |
| Norstat | 14–20 May | ≥1,000 | 28.6 | 21.5 | 22.0 | 8.8 | 9.4 | 5.3 | 2.2 | 0.7 | 1.5 | 6.6 | 52.3 | 46.2 |
| Turu-uuringute AS | 2–15 May | 2,037 | 27 | 20 | 17 | 10 | 10 | 8 | 3 | 1 | 1 | 7 | 47 | 49 |
| Norstat | 6–13 May | ≥1,000 | 31.8 | 19.4 | 16.2 | 8.0 | 12.2 | 5.1 | 4.5 | 0.3 | 2.0 | 12.4 | 43.6 | 53.9 |
| Kantar Emor | 7–9 May | 1,271 | 33.5 | 15.3 | 16.9 | 6.1 | 12.9 | 11.5 | - | 3.8 | 16.6 | 38.3 | 57.9 | |
| Norstat | 29 Apr–7 May | ≥1,000 | 35.6 | 19.9 | 15.0 | 8.3 | 10.8 | 6.0 | 2.5 | 0.5 | 1.6 | 15.7 | 43.2 | 55.4 |
| Norstat | 22–29 Apr | ≥1,000 | 33.6 | 18.5 | 19.1 | 7.6 | 8.5 | 7.2 | 3.4 | 0.3 | 1.9 | 14.5 | 45.2 | 53.0 |
| The Jüri Ratas' second cabinet is formed by the Centre, EKRE and Pro Patria. | ||||||||||||||
| Norstat | 15–22 Apr | ≥1,000 | 32 | 20.1 | 20.1 | 9.2 | 8.4 | 5.4 | 2.6 | 0.7 | 0.7 | 11.9 | 49.4 | 49.1 |
| Kantar Emor | 10–15 Apr | 1,000 | 32.3 | 17 | 15.4 | 8.5 | 11.4 | 10.3 | 2.7 | 1.1 | - | 15.3 | 40.9 | 57.8 |
| Norstat | 8–15 Apr | 1,000 | 34.6 | 19.4 | 18 | 7.3 | 10.1 | 5.9 | 2.5 | 0.3 | 1.6 | 16 | 44.7 | 53.4 |
| Norstat | 18 Mar–15 Apr | 4,014 | 33.0 | 20.6 | 17.9 | 9.4 | 9.2 | 5.8 | 2.3 | – | 1.8 | 12.4 | 47.9 | 50.3 |
| Norstat | 1–8 Apr | 1,000 | 33.4 | 22.5 | 14.8 | 11.6 | 8.0 | 4.8 | 3.0 | 0.5 | 1.3 | 10.9 | 48.9 | 49.7 |
| Norstat | 25–29 Mar | 1,000 | 32.5 | 20.5 | 19.1 | 9.0 | 10.1 | 5.5 | 1.7 | 0.6 | 1.0 | 12.0 | 48.6 | 50.4 |
| Norstat | 18–24 Mar | 1,000 | 31.9 | 19.5 | 18.8 | 8.9 | 9.3 | 7.2 | 2.1 | 0.9 | 1.5 | 12.4 | 47.2 | 51.4 |
| Kantar Emor | 14–21 Mar | 1,214 | 32 | 17 | 18 | 7 | 11 | 10 | 3 | 0.3 | 1.7 | 14.0 | 42.0 | 56.3 |
| Turu-uuringute AS | 5–18 Mar | 1,004 | 27 | 24 | 21 | 11 | 9 | 5 | 1 | 1 | 1 | 3.0 | 56.0 | 43.0 |
| Norstat | 11–15 Mar | 1,000 | 36.9 | 19.4 | 12.6 | 11.2 | 9.0 | 6.5 | 1.7 | 0.6 | 2.1 | 17.5 | 43.2 | 54.7 |
| Kantar Emor | 12–13 Mar | 752 | 30 | 19.4 | 18.1 | 7.3 | 12.5 | 8.5 | 1.7 | 0.6 | 2.2 | 10.6 | 44.8 | 53.3 |
| Norstat | 5–11 Mar | 1,000 | 31.9 | 21.2 | 18.1 | 11.4 | 9.1 | 4.4 | 1.7 | 1.1 | 1.2 | 10.7 | 50.7 | 48.2 |
| Election Results | 3 Mar | N/A | 28.9 | 23.1 | 17.8 | 11.4 | 9.8 | 4.4 | 1.8 | 1.2 | 1.6 | 5.7 | 52.3 | 46.1 |
| 34 | 26 | 19 | 12 | 10 | 0 | 0 | 0 | 8.0 | 57 | 44 | ||||
References
This article is issued from Wikipedia. The text is licensed under Creative Commons - Attribution - Sharealike. Additional terms may apply for the media files.