1882 Canadian federal election
The 1882 Canadian federal election was held on June 20, 1882, to elect members of the House of Commons of Canada of the 5th Parliament of Canada.
| ||||||||||||||||||||||||||||||||||
211 seats in the House of Commons 106 seats needed for a majority | ||||||||||||||||||||||||||||||||||
|---|---|---|---|---|---|---|---|---|---|---|---|---|---|---|---|---|---|---|---|---|---|---|---|---|---|---|---|---|---|---|---|---|---|---|
| Turnout | 70.3%[1] ( | |||||||||||||||||||||||||||||||||
| ||||||||||||||||||||||||||||||||||
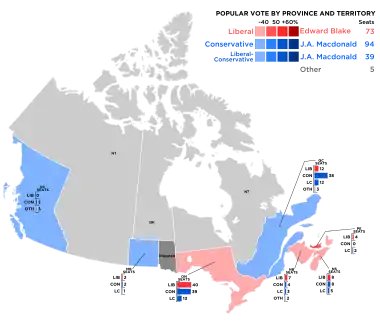 1882 Canadian electoral map | ||||||||||||||||||||||||||||||||||
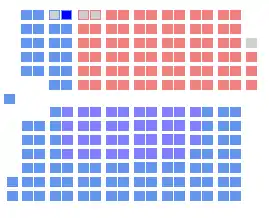 The Canadian parliament after the 1882 election | ||||||||||||||||||||||||||||||||||
| ||||||||||||||||||||||||||||||||||
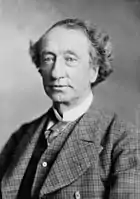

Prime Minister Sir John A. Macdonald's Conservatives and Liberal-Conservatives retained power, defeating the Liberal Party of Edward Blake.
National results
 | ||||||
| ↓ | ||||||
| 133 | 73 | 5 | ||||
| Conservative | Liberal | O | ||||
| Party | Party leader | # of candidates |
Seats | Popular vote | |||||
|---|---|---|---|---|---|---|---|---|---|
| 1878 | Elected | Change | # | % | Change | ||||
| Conservative | John A. Macdonald | 118 | 83 | 94 | +13.3% | 143,684 | 27.83% | -1.67pp | |
| Liberal-Conservative | 50 | 46 | 39 | -8.7% | 64,860 | 12.56% | -3.22pp | ||
| Liberal | Edward Blake | 112 | 57 | 73 | +26.3% | 160,547 | 31.10% | +1.95pp | |
| Independent | 7 | 5 | 1 | -80% | 8,227 | 1.59% | -1.12pp | ||
| Nationalist Conservative | 1 | - | 1 | - | 1,084 | 0.21% | +0.14pp | ||
| Independent Liberal | 3 | 2 | 2 | - | 5,740 | 1.11% | +0.12pp | ||
| Independent Conservative | 2 | 2 | 1 | -50% | 927 | 0.18% | - | ||
| Unknown | 121 | 9 | - | -100% | 131,178 | 25.41% | +4.48pp | ||
| Total | 414 | 204 | 211 | +4.4% | 516,247 | 100.0% | - | ||
| Sources: http://www.elections.ca -- History of Federal Ridings since 1867 | |||||||||
Acclamations:
The following Members of Parliament were elected by acclamation;
- British Columbia: 2 Liberal-Conservatives
- Manitoba: 1 Conservative
- Ontario: 2 Conservatives
- Quebec: 11 Conservatives, 1 Independent Conservative, 4 Liberal-Conservatives, 3 Liberals
- New Brunswick: 1 Liberal-Conservative, 1 Independent
- Nova Scotia: 1 Conservative
Results by province
| Party name | BC | MB | ON | QC | NB | NS | PE | Total | ||
|---|---|---|---|---|---|---|---|---|---|---|
| Conservative | Seats: | 3 | 2 | 39 | 38 | 4 | 8 | - | 94 | |
| Popular vote (%): | 38.4 | 13.6 | 27.0 | 37.7 | 25.6 | 23.0 | 17.1 | 27.8 | ||
| Liberal-Conservative | Seats: | 3 | 1 | 13 | 12 | 3 | 5 | 2 | 39 | |
| Vote (%): | 15.8 | 38.9 | 9.1 | 10.4 | 7.1 | 25.8 | 25.4 | 12.6 | ||
| Liberal | Seats: | - | 2 | 40 | 12 | 7 | 8 | 4 | 73 | |
| Vote (%): | 10.6 | 25.3 | 31.9 | 21.5 | 36.8 | 38.7 | 40.7 | 31.1 | ||
| Independent | Seats: | - | - | 1 | - | 1 | ||||
| Vote (%): | 1.7 | 0.8 | 0.4 | 4.8 | 1.6 | |||||
| Nationalist Conservative | Seats: | 1 | 1 | |||||||
| Vote (%): | 1.0 | 0.2 | ||||||||
| Independent Liberal | Seats: | - | 1 | 1 | 2 | |||||
| Vote (%): | 0.7 | 1.5 | 6.2 | 1.1 | ||||||
| Independent Conservative | Seats: | 1 | 1 | |||||||
| Vote (%): | 0.9 | 0.2 | ||||||||
| Unknown | Vote (%): | 35.2 | 22.2 | 29.6 | 27.1 | 23.9 | 7.7 | 16.8 | 25.4 | |
| Total seats | 6 | 5 | 92 | 65 | 16 | 21 | 6 | 211 | ||
Vote and seat summaries
xx – less than 0.05% of the popular vote
References
- "Voter Turnout at Federal Elections and Referendums". Elections Canada. Retrieved 10 March 2019.
This article is issued from Wikipedia. The text is licensed under Creative Commons - Attribution - Sharealike. Additional terms may apply for the media files.