1964 Danish general election
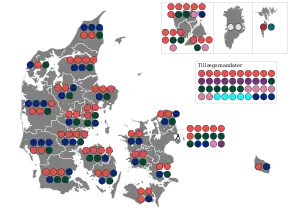
General elections were held in Denmark on 22 September 1964.[1] The Social Democratic Party remained the largest in the Folketing, with 76 of the 179 seats. Voter turnout was 85.5% in Denmark proper, 50.2% in the Faroe Islands and 48.9% in Greenland.[2] They were the first elections with the new electoral threshold of 2%.
| |||||||||||||||||||||||||||||||||||||||||||||||||||||||||||||
| Turnout | 85.1% | ||||||||||||||||||||||||||||||||||||||||||||||||||||||||||||
|---|---|---|---|---|---|---|---|---|---|---|---|---|---|---|---|---|---|---|---|---|---|---|---|---|---|---|---|---|---|---|---|---|---|---|---|---|---|---|---|---|---|---|---|---|---|---|---|---|---|---|---|---|---|---|---|---|---|---|---|---|---|
This lists parties that won seats. See the complete results below. | |||||||||||||||||||||||||||||||||||||||||||||||||||||||||||||
 | |||||||||||||||||||||||||||||||||||||||||||||||||||||||||||||
Results
| Denmark | ||||
|---|---|---|---|---|
| Party | Votes | % | Seats | +/– |
| Social Democratic Party | 1,103,667 | 41.9 | 76 | 0 |
| Venstre | 547,770 | 20.8 | 38 | 0 |
| Conservative People's Party | 527,798 | 20.1 | 36 | +4 |
| Socialist People's Party | 151,697 | 5.8 | 10 | –1 |
| Danish Social Liberal Party | 139,702 | 5.3 | 10 | –1 |
| Independent Party | 65,756 | 2.5 | 5 | –1 |
| Justice Party of Denmark | 34,258 | 1.3 | 0 | 0 |
| Communist Party of Denmark | 32,390 | 1.2 | 0 | 0 |
| Danish Unity | 9,747 | 0.4 | 0 | New |
| Schleswig Party | 9,274 | 0.4 | 0 | –1 |
| Peace Politics People's Party | 9,070 | 0.3 | 0 | New |
| Independents | 255 | 0.0 | 0 | 0 |
| Invalid/blank votes | 9,472 | – | – | – |
| Total | 2,640,856 | 100 | 175 | 0 |
| Faroe Islands | ||||
| Social Democratic Party | 4,133 | 39.3 | 1 | 0 |
| Union Party | 3,121 | 29.7 | 0 | –1 |
| People's Party | 2,622 | 25.0 | 1 | +1 |
| Progress Party | 631 | 6.0 | 0 | New |
| Invalid/blank votes | 56 | – | – | – |
| Total | 10,563 | 100 | 2 | 0 |
| Greenland | ||||
| Independents | 8,332 | 100 | 2 | 0 |
| Invalid/blank votes | 97 | – | – | – |
| Total | 8,429 | 100 | 2 | 0 |
| Source: Nohlen & Stöver | ||||
References
- Dieter Nohlen & Philip Stöver (2010) Elections in Europe: A data handbook, p524 ISBN 978-3-8329-5609-7
- Nohlen & Stöver, pp542-543
| Folketing elections |
|
|---|---|
| Landsting elections | |
| European elections | |
| Local elections | |
| Other elections |
|
| Referendums | |
| |
This article is issued from Wikipedia. The text is licensed under Creative Commons - Attribution - Sharealike. Additional terms may apply for the media files.