1966 Edinburgh Corporation election
An Election to the Edinburgh Corporation was held on 3 May 1966, alongside municipal elections across Scotland. Of the councils 69 seats, 23 were up for election.
| |||||||||||||||||||||||||||||||||
23 of the 69 seats to the Edinburgh Corporation 35 seats needed for a majority | |||||||||||||||||||||||||||||||||
|---|---|---|---|---|---|---|---|---|---|---|---|---|---|---|---|---|---|---|---|---|---|---|---|---|---|---|---|---|---|---|---|---|---|
| |||||||||||||||||||||||||||||||||
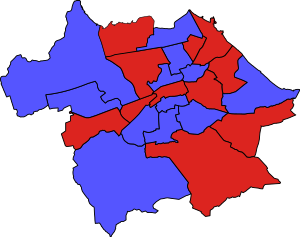 Results by ward. | |||||||||||||||||||||||||||||||||
| |||||||||||||||||||||||||||||||||
After the election Edinburgh Corporation wa composed of 36 Progressives, 33 Labour councillors, and 1 Liberal. The Progressives increased their majority to three seats.
Aggregate results
| Party | Seats | Gains | Losses | Net gain/loss | Seats % | Votes % | Votes | +/− | |
|---|---|---|---|---|---|---|---|---|---|
| Progressives | 14 | 1 | 0 | 60.9 | 43.6 | 42,397 | |||
| Labour | 9 | 0 | 0 | 39.1 | 41.7 | 40,581 | |||
| Liberal | 0 | 0 | 1 | 0.0 | 10.0 | 9,751 | |||
| Conservative | 0 | 0 | 0 | 0.0 | 3.5 | 3,363 | |||
| SNP | 0 | 0 | 0 | 0.0 | 0.7 | 661 | |||
| Communist | 0 | 0 | 0 | 0.0 | 0.5 | 515 | |||
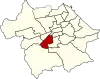
Ward Results
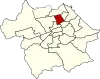
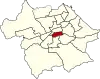
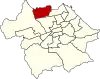
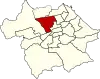
Location of Broughton ward
| Party | Candidate | Votes | % | ||
|---|---|---|---|---|---|
| Progressives | Melville Dinwiddie | Unopposed | |||
| Progressives hold | |||||
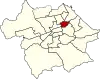
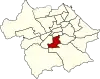
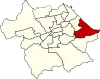
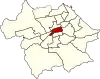
Location of Calton ward
| Party | Candidate | Votes | % | |
|---|---|---|---|---|
| Progressives | Josephine M. Dickson | 2,571 | ||
| Labour | Charles R. Stuart | 2,489 | ||
| Majority | 82 | |||
| Progressives hold | ||||
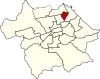
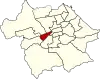
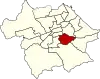
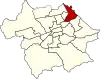
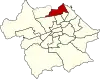
Location of Central Leith ward
| Party | Candidate | Votes | % | |
|---|---|---|---|---|
| Labour | John A. Crichton | 2,182 | ||
| Progressives | Victor J. Syme | 591 | ||
| SNP | Mary G. Thomson | 262 | ||
| Communist | Theodore C. Taylor | 40 | ||
| Majority | 1,591 | |||
| Labour hold | ||||
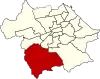
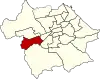
Location of Colinton ward
| Party | Candidate | Votes | % | |
|---|---|---|---|---|
| Progressives | Maurice F. Ferry | 4,911 | ||
| Labour | Eva Gibbons | 2,301 | ||
| Majority | 2,610 | |||
| Progressives hold | ||||
Location of Corstorphine ward
| Party | Candidate | Votes | % | |
|---|---|---|---|---|
| Progressives | Mary Robertson Murray | 4,280 | ||
| Liberal | Margaret K. Taylor | 2,788 | ||
| Majority | 1,422 | |||
| Progressives hold | ||||
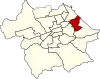
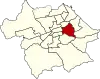
Location of Craigentinny ward
| Party | Candidate | Votes | % | |
|---|---|---|---|---|
| Labour | Alexander Sutherland | 3,396 | ||
| Progressives | Rupert Spoyer | 1,924 | ||
| Majority | 1,472 | |||
| Labour hold | ||||
Location of Craigmillar ward
| Party | Candidate | Votes | % | |
|---|---|---|---|---|
| Labour | Russell A. Fer | 2,723 | ||
| Communist | Michael d'Arcy | 298 | ||
| Majority | 2,425 | |||
| Labour hold | ||||
Location of George Square ward
| Party | Candidate | Votes | % | |
|---|---|---|---|---|
| Progressives | Clive F. Murphy | 2,266 | ||
| Labour | George Foulkes | 1,084 | ||
| Majority | 1,182 | |||
| Progressives hold | ||||
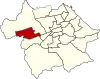
Location of Gorgie-Dalry ward
| Party | Candidate | Votes | % | |
|---|---|---|---|---|
| Labour | Thomas McGregor | 2,596 | ||
| Liberal | George F. Smith | 1,139 | ||
| Majority | 1,457 | |||
| Labour hold | ||||
Location of Holyrood ward
| Party | Candidate | Votes | % | |
|---|---|---|---|---|
| Labour | Owen Hand | 1,629 | ||
| Liberal | Roberts E. Bell | 567 | ||
| Conservative | James L. Walls | 501 | ||
| Communist | Martin E. Currie | 44 | ||
| Majority | 1,062 | |||
| Labour hold | ||||
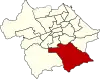
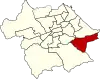
Location of Liberton ward
| Party | Candidate | Votes | % | |
|---|---|---|---|---|
| Labour | Frederick M. Lawson | 4,453 | ||
| Conservative | James S. Gordon | 2,862 | ||
| Majority | 1,591 | |||
| Labour hold | ||||
Location of Merchiston ward
| Party | Candidate | Votes | % | |
|---|---|---|---|---|
| Progressives | Thomas Morgan | 3,171 | ||
| Liberal | Bethia L. Howden | 2,025 | ||
| Majority | 1,146 | |||
| Progressives hold | ||||
Location of Morningside ward
| Party | Candidate | Votes | % | ||
|---|---|---|---|---|---|
| Progressives | John Bateman | Unopposed | |||
| Progressives hold | |||||
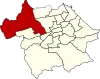
Location of Murrayfield-Cramond ward
| Party | Candidate | Votes | % | |
|---|---|---|---|---|
| Progressives | Hugh Macpherson | 5,294 | ||
| Labour | David Millar | 2,040 | ||
| Majority | 3,254 | |||
| Progressives hold | ||||
Location of Newington ward
| Party | Candidate | Votes | % | |
|---|---|---|---|---|
| Progressives | John D. Kidd | 3,605 | ||
| Liberal | Hilda S. Morton | 3,232 | ||
| Labour | Donald E. S. Truman | 1,405 | ||
| Majority | 373 | |||
| Progressives gain from Liberal | ||||
Location of Pilton ward
| Party | Candidate | Votes | % | |
|---|---|---|---|---|
| Labour | Robert W. Irvine | 2,977 | ||
| Progressives | Anthony H. Lester | 643 | ||
| SNP | George B. Stewart | 399 | ||
| Communist | Charles McManus | 133 | ||
| Majority | 2,334 | |||
| Labour hold | ||||
Location of Portobello ward
| Party | Candidate | Votes | % | |
|---|---|---|---|---|
| Progressives | Kenneth W. Berthwick | 3,776 | ||
| Labour | Ronald D. M. Brown | 1,897 | ||
| Majority | 1,879 | |||
| Progressives hold | ||||
Location of Sighthill ward
| Party | Candidate | Votes | % | |
|---|---|---|---|---|
| Labour | William Wallace | 3,922 | ||
| Progressives | Richard K. Aitken | 1,172 | ||
| Labour hold | ||||
Location of South Leith
| Party | Candidate | Votes | % | |
|---|---|---|---|---|
| Labour | Shelia King Murray | 3,077 | ||
| Progressives | Thomas S. Ramage | 2,719 | ||
| Majority | 358 | |||
| Labour hold | ||||

Location of St Andrews ward
| Party | Candidate | Votes | % | |
|---|---|---|---|---|
| Progressives | Robert McLaughlin | 1,664 | ||
| Labour | Phyllis Herriot | 772 | ||
| Majority | 892 | |||
| Progressives hold | ||||
Location of St Bernards ward
| Party | Candidate | Votes | % | ||
|---|---|---|---|---|---|
| Labour | David A. Adamson | Unopposed | |||
| Labour hold | |||||
Location of St Giles ward
| Party | Candidate | Votes | % | ||
|---|---|---|---|---|---|
| Labour | James McInally | Unopposed | |||
| Labour hold | |||||
Location of West Leith ward
| Party | Candidate | Votes | % | |
|---|---|---|---|---|
| Progressives | William R. W. Lyle | 3,810 | ||
| Labour | Henry D. Crawford | 1,638 | ||
| Majority | 2,177 | |||
| Progressives hold | ||||
References
- "Results in the Municipal Elections". The Glasgow Herald. 5 May 1966. p. 11. Retrieved 2 February 2020.
(1965 ←) | |
|---|---|
| City corporations |
|
| Edinburgh Corporation |
|
|---|---|
| City of Edinburgh District Council | |
| Lothian Regional Council | |
| City of Edinburgh Council | |
| Referendums | |
This article is issued from Wikipedia. The text is licensed under Creative Commons - Attribution - Sharealike. Additional terms may apply for the media files.