2005 Buckinghamshire County Council election
Elections to Buckinghamshire County Council were held on 5 May 2005, alongside the 2005 UK General Election and other local elections in England and Northern Ireland. The entire council was up for election, with each successful candidate serving a four-year term of office, expiring in 2009.
| |||||||||||||||||||||||||||||
All 57 seats to Buckinghamshire County Council 29 seats needed for a majority | |||||||||||||||||||||||||||||
|---|---|---|---|---|---|---|---|---|---|---|---|---|---|---|---|---|---|---|---|---|---|---|---|---|---|---|---|---|---|
| |||||||||||||||||||||||||||||
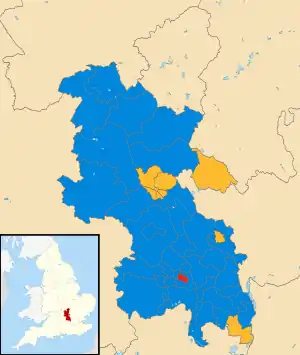 Map showing the results of the 2005 Buckinghamshire County Council elections. | |||||||||||||||||||||||||||||
| |||||||||||||||||||||||||||||
The Conservative Party remained in overall control of the council, winning 44 out of 57 seats. 11 of the remaining seats were won by the Liberal Democrats, whilst the remaining 2 were won by Labour.[1]
Result
| Party | Seats | Gains | Losses | Net gain/loss | Seats % | Votes % | Votes | +/− | |
|---|---|---|---|---|---|---|---|---|---|
| Conservative | 44 | +4 | 77.19 | 49.67 | 146,980 | ||||
| Liberal Democrats | 11 | +2 | 19.30 | 32.88 | 97,289 | ||||
| Labour | 2 | -3 | 3.51 | 15.91 | 47,072 | ||||
| Aylesbury Residents Action | 0 | 0 | 0.87 | 2,587 | |||||
| UKIP | 0 | 0 | 0.41 | 1,200 | |||||
| Green | 0 | 0 | 0.26 | 777 | |||||
The overall turnout was 65.4% with a total of 295,905 valid votes cast. A total of 2,397 ballots were rejected.
Council Composition
Following the last election in 2001 the composition of the council was:
| 40 | 9 | 5 |
| Conservatives | Liberal Democrats | Labour |
After the election, the composition of the council was:
| 44 | 11 | 2 |
| Conservatives | Liberal Democrats | Labour |
Ward Results
All results by ward are listed below. The turnout numbers recorded is the valid voter turnout, not the total number of ballots cast including those that were spoiled.[2]
Abbey
| Party | Candidate | Votes | % | |
|---|---|---|---|---|
| Conservative | Lesley Clarke | 1,804 | 50.1 | |
| Labour | Carolyn Pudney | 996 | 27.7 | |
| Liberal Democrats | Stephen Guy | 801 | 22.2 | |
| Majority | 808 | 22.4 | ||
| Turnout | 3,601 | 60.2 | ||
| Conservative hold | ||||
Alderbourne
| Party | Candidate | Votes | % | |
|---|---|---|---|---|
| Conservative | William Lidgate | 2,339 | 61.8 | |
| Liberal Democrats | Edwina Mitchell | 1,446 | 38.2 | |
| Majority | 893 | 23.6 | ||
| Turnout | 3,785 | 62.5 | ||
| Conservative hold | ||||
Amersham
| Party | Candidate | Votes | % | |
|---|---|---|---|---|
| Conservative | David Meacock | 3,770 | 24.2 | |
| Conservative | Pauline Wilkinson | 3,651 | 23.4 | |
| Liberal Democrats | Davida Allen | 3,567 | 22.9 | |
| Liberal Democrats | Patricia Pearce | 2,739 | 17.6 | |
| Labour | Lynda Greenhill | 959 | 6.1 | |
| Labour | David Tench | 909 | 5.8 | |
| Majority | 84 | 0.5 | ||
| Turnout | 8,707 | 66.0 | ||
| Conservative hold | ||||
| Conservative hold | ||||
Aston Clinton
| Party | Candidate | Votes | % | |
|---|---|---|---|---|
| Conservative | William Chapple | 3,062 | 64.1 | |
| Liberal Democrats | Peter Vernon | 1,440 | 30.2 | |
| Aylesbury Residents Action | Andrew Hill | 273 | 5.7 | |
| Majority | 1,622 | 33.9 | ||
| Turnout | 4,775 | 68.6 | ||
| Conservative hold | ||||
Aylesbury East
| Party | Candidate | Votes | % | |
|---|---|---|---|---|
| Liberal Democrats | Chloe Willetts | 2,789 | 21.4 | |
| Liberal Democrats | Raj Khan | 2,482 | 19.0 | |
| Conservative | Andrew Huxley | 2,377 | 18.2 | |
| Conservative | Abdul Khaliq | 1,791 | 13.7 | |
| Labour | Richard Wells | 1,224 | 9.4 | |
| Labour | Mohammed Khaliel | 1,084 | 8.3 | |
| Independent | Patrick Martin | 659 | 5.1 | |
| Aylesbury Residents Action | Julia Powell | 323 | 2.5 | |
| Aylesbury Residents Action | Elsie Davies | 303 | 2.3 | |
| Majority | 105 | 0.8 | ||
| Turnout | 13,032 | 60.0 | ||
| Liberal Democrats hold | ||||
| Liberal Democrats hold | ||||
Aylesbury North
| Party | Candidate | Votes | % | |
|---|---|---|---|---|
| Liberal Democrats | Mary Baldwin | 2,159 | 22.2 | |
| Liberal Democrats | Niknam Hussain | 1,665 | 17.1 | |
| Conservative | Jane Sale | 1,587 | 16.3 | |
| Conservative | Wajid Kiani | 1,262 | 13.0 | |
| Labour | Philip McGoldrick | 1,225 | 12.6 | |
| Labour | Sandra Moorcroft | 1,019 | 10.5 | |
| Aylesbury Residents Action | Suzanna Copcutt | 419 | 4.3 | |
| Aylesbury Residents Action | David Davies | 379 | 3.9 | |
| Majority | 78 | 5.1 | ||
| Turnout | 9,715 | 52.2 | ||
| Liberal Democrats hold | ||||
| Liberal Democrats hold | ||||
Aylesbury South
| Party | Candidate | Votes | % | |
|---|---|---|---|---|
| Liberal Democrats | Denise Summers | 1,446 | 39.0 | |
| Conservative | Elisabeth Wilkins | 1,435 | 38.7 | |
| Labour | Henry Gardner | 730 | 19.7 | |
| Aylesbury Residents Action | Margaret Martin | 100 | 2.7 | |
| Majority | 11 | 0.3 | ||
| Turnout | 3,711 | 61.1 | ||
| Liberal Democrats hold | ||||
Aylesbury South East
| Party | Candidate | Votes | % | |
|---|---|---|---|---|
| Liberal Democrats | Chester Jones | 2,330 | 47.4 | |
| Conservative | John Champion | 1,917 | 39.0 | |
| Labour | Adrian Mumford-Smith | 570 | 11.6 | |
| Aylesbury Residents Action | Dennis Price | 95 | 1.9 | |
| Majority | 413 | 8.4 | ||
| Turnout | 4,912 | 72.0 | ||
| Liberal Democrats hold | ||||
Aylesbury West
| Party | Candidate | Votes | % | |
|---|---|---|---|---|
| Liberal Democrats | Freda Roberts | 3,074 | 21.1 | |
| Liberal Democrats | Steve Kennell | 3,050 | 21.0 | |
| Conservative | Brian Foster | 2,283 | 15.7 | |
| Conservative | John Wiseman | 2,283 | 15.7 | |
| Labour | Neal Bonham | 1,755 | 12.1 | |
| Labour | Zard Khan | 1,479 | 10.2 | |
| Aylesbury Residents Action | Julie Ludlow | 333 | 2.3 | |
| Aylesbury Residents Action | Martin Hill | 292 | 2.0 | |
| Majority | 767 | 5.3 | ||
| Turnout | 14,549 | 54.5 | ||
| Liberal Democrats hold | ||||
| Liberal Democrats hold | ||||
Beaconsfield
| Party | Candidate | Votes | % | |
|---|---|---|---|---|
| Conservative | Margaret Dewar | 2,546 | 65.1 | |
| Liberal Democrats | Barbara Wainwright | 856 | 21.9 | |
| Labour | Stephen Lathrope | 511 | 13.1 | |
| Majority | 1,690 | 43.2 | ||
| Turnout | 3,913 | 67.7 | ||
| Conservative hold | ||||
Bernwood
| Party | Candidate | Votes | % | |
|---|---|---|---|---|
| Conservative | Michael Edmonds | 3,189 | 59.0 | |
| Labour | Joanna Dodsworth | 1,113 | 20.6 | |
| Liberal Democrats | Alan Sherwell | 1,106 | 20.5 | |
| Majority | 2,076 | 38.4 | ||
| Turnout | 5,408 | 72.9 | ||
| Conservative hold | ||||
Booker, Cressex & Sands
| Party | Candidate | Votes | % | |
|---|---|---|---|---|
| Conservative | Alan Hill | 1,397 | 39.0 | |
| Labour | Nigel Vickery | 1,303 | 36.4 | |
| Liberal Democrats | Tuffail Hussain | 529 | 14.8 | |
| UKIP | Lynne Pearce | 354 | 9.9 | |
| Majority | 94 | 2.6 | ||
| Turnout | 3,583 | 58.2 | ||
| Conservative hold | ||||
Bowerdean, Micklefield & Totteridge
| Party | Candidate | Votes | % | |
|---|---|---|---|---|
| Labour | Julia Wassell | 2,555 | 24.3 | |
| Labour | Chaudhary Ditta | 2,003 | 19.0 | |
| Conservative | Kathleen Dix | 1,874 | 17.8 | |
| Conservative | Ian McEnnis | 1,756 | 16.7 | |
| Liberal Democrats | Frances Alexander | 1,185 | 11.2 | |
| Liberal Democrats | Ian Morton | 1,163 | 11.0 | |
| Majority | 129 | 1.2 | ||
| Turnout | 10,536 | 53.9 | ||
| Labour hold | ||||
| Labour hold | ||||
Buckingham North
| Party | Candidate | Votes | % | |
|---|---|---|---|---|
| Conservative | David Polhill | 2,141 | 50.7 | |
| Labour | Robert Lehmann | 1,194 | 28.3 | |
| Liberal Democrats | Robert Lewis | 884 | 21.0 | |
| Majority | 947 | 22.4 | ||
| Turnout | 4,219 | 63.0 | ||
| Conservative hold | ||||
Buckingham South
| Party | Candidate | Votes | % | |
|---|---|---|---|---|
| Conservative | Hedley Cadd | 2,374 | 49.2 | |
| Labour | Robin Stuchbury | 1,718 | 35.6 | |
| Liberal Democrats | Michael Cashman | 738 | 15.3 | |
| Majority | 656 | 13.6 | ||
| Turnout | 4,830 | 68.0 | ||
| Conservative hold | ||||
Bulstrode
| Party | Candidate | Votes | % | |
|---|---|---|---|---|
| Conservative | Peter Hardy | 2,513 | 65.2 | |
| Liberal Democrats | Jane Hartley | 850 | 22.0 | |
| Labour | Phillip Oram | 493 | 12.8 | |
| Majority | 1,663 | 43.2 | ||
| Turnout | 3,856 | 66.1 | ||
| Conservative hold | ||||
Burnham Beeches
| Party | Candidate | Votes | % | |
|---|---|---|---|---|
| Conservative | Linda Hazell | 2,239 | 60.5 | |
| Liberal Democrats | David Linsdall | 802 | 21.7 | |
| Labour | Mark Craddock | 658 | 17.8 | |
| Majority | 1,437 | 38.8 | ||
| Turnout | 3,699 | 61.2 | ||
| Conservative hold | ||||
Chalfont St Peter
| Party | Candidate | Votes | % | |
|---|---|---|---|---|
| Conservative | Bruce Allen | 2,512 | 59.8 | |
| Liberal Democrats | Richard Williams | 1,006 | 24.0 | |
| Labour | Malcolm Horne | 682 | 16.2 | |
| Majority | 1,506 | 35.8 | ||
| Turnout | 4,200 | 62.8 | ||
| Conservative hold | ||||
Chesham East
| Party | Candidate | Votes | % | |
|---|---|---|---|---|
| Liberal Democrats | Patricia Lindsley | 2,003 | 44.4 | |
| Conservative | Mohammed Bhatti | 1,632 | 36.1 | |
| Labour | Kathryn Drinkall | 532 | 11.8 | |
| Green | Nicholas Wilkins | 348 | 7.7 | |
| Majority | 371 | 8.3 | ||
| Turnout | 4,515 | 65.4 | ||
| Liberal Democrats hold | ||||
Chesham North West
| Party | Candidate | Votes | % | |
|---|---|---|---|---|
| Conservative | Steven Adams | 1,363 | 38.8 | |
| Liberal Democrats | Michael Brand | 1,333 | 38.0 | |
| Labour | Peter Ward | 632 | 18.0 | |
| Green | Phillip Folly | 184 | 5.2 | |
| Majority | 30 | 0.8 | ||
| Turnout | 3,512 | 65.8 | ||
| Conservative hold | ||||
Chess Valley
| Party | Candidate | Votes | % | |
|---|---|---|---|---|
| Conservative | Hugh Wilson | 1,439 | 42.2 | |
| Liberal Democrats | Jane Bramwell | 1,225 | 35.9 | |
| Labour | David Cross | 499 | 14.6 | |
| Green | Kathleen Folly | 245 | 7.2 | |
| Majority | 214 | 6.3 | ||
| Turnout | 3,408 | 64.5 | ||
| Conservative hold | ||||
Chiltern Ridges
| Party | Candidate | Votes | % | |
|---|---|---|---|---|
| Conservative | Patricia Birchley | 2,395 | 59.8 | |
| Liberal Democrats | John Clutterbuck | 1,222 | 30.5 | |
| Labour | Barbara Hunter | 389 | 9.7 | |
| Majority | 1,173 | 29.3 | ||
| Turnout | 4,006 | 72.1 | ||
| Conservative hold | ||||
Chiltern Valley
| Party | Candidate | Votes | % | |
|---|---|---|---|---|
| Conservative | Robert Woollard | 2,221 | 57.0 | |
| Liberal Democrats | Neil Timberlake | 814 | 20.9 | |
| Labour | Kathleen Draper | 689 | 17.7 | |
| UKIP | Brian Pearce | 171 | 4.4 | |
| Majority | 1,407 | 36.1 | ||
| Turnout | 3,895 | 65.5 | ||
| Conservative hold | ||||
Downley, Disraeli, Oakridge & Castlefield
| Party | Candidate | Votes | % | |
|---|---|---|---|---|
| Conservative | Wendy Mallen | 2,991 | 21.3 | |
| Conservative | Zahir Mohammed | 2,521 | 17.9 | |
| Liberal Democrats | Pamela Brooks | 2,282 | 16.2 | |
| Labour | Sajid Ali | 2,260 | 16.1 | |
| Labour | Chaudry Shafique | 2,247 | 16.0 | |
| Liberal Democrats | William Doran | 1,749 | 12.4 | |
| Majority | 239 | 1.7 | ||
| Turnout | 14,050 | 60.4 | ||
| Conservative hold | ||||
| Conservative hold | ||||
Gerrards Cross & Denham North
| Party | Candidate | Votes | % | |
|---|---|---|---|---|
| Conservative | Peter Roberts | 2,260 | 63.6 | |
| Liberal Democrats | Gillian Underwood | 815 | 22.9 | |
| Labour | John Hunter | 481 | 13.5 | |
| Majority | 1,445 | 40.7 | ||
| Turnout | 3,556 | 62.8 | ||
| Conservative hold | ||||
Great Brickhill
| Party | Candidate | Votes | % | |
|---|---|---|---|---|
| Conservative | Brenda Jennings | 2,765 | 60.8 | |
| Liberal Democrats | Llewellyn Monger | 1,781 | 39.2 | |
| Majority | 984 | 21.6 | ||
| Turnout | 4,546 | 72.1 | ||
| Conservative hold | ||||
Great Missenden
| Party | Candidate | Votes | % | |
|---|---|---|---|---|
| Conservative | Michael Colston | 2,882 | 58.8 | |
| Liberal Democrats | Sebastian Berry | 2,018 | 41.2 | |
| Majority | 864 | 17.6 | ||
| Turnout | 4,900 | 70.9 | ||
| Conservative hold | ||||
Greater Hughenden
| Party | Candidate | Votes | % | |
|---|---|---|---|---|
| Conservative | Richard Pushman | 3,123 | 64.6 | |
| Liberal Democrats | William Barnes | 1,710 | 35.4 | |
| Majority | 1,413 | 29.2 | ||
| Turnout | 4,833 | 73.9 | ||
| Conservative hold | ||||
Grendon Underwood
| Party | Candidate | Votes | % | |
|---|---|---|---|---|
| Conservative | John Cartwright | 2,744 | 56.6 | |
| Liberal Democrats | Ian Metherell | 2,100 | 43.4 | |
| Majority | 644 | 13.2 | ||
| Turnout | 4,844 | 67.0 | ||
| Conservative hold | ||||
Haddenham
| Party | Candidate | Votes | % | |
|---|---|---|---|---|
| Conservative | Margaret Aston | 2,494 | 55.8 | |
| Liberal Democrats | Eileen Young | 1,978 | 44.2 | |
| Majority | 516 | 11.6 | ||
| Turnout | 4,472 | 70.0 | ||
| Conservative hold | ||||
Hazelmere
| Party | Candidate | Votes | % | |
|---|---|---|---|---|
| Conservative | David Carroll | 3,471 | 71.8 | |
| Labour | Ian Bates | 1,364 | 28.2 | |
| Majority | 2,107 | 43.6 | ||
| Turnout | 4,835 | 65.9 | ||
| Conservative hold | ||||
Icknield and Bledlow
| Party | Candidate | Votes | % | |
|---|---|---|---|---|
| Conservative | Paul Rogerson | 3,124 | 65.7 | |
| Liberal Democrats | Lee Harte | 1,092 | 23.0 | |
| Labour | Anne Edwards | 541 | 11.4 | |
| Majority | 2,032 | 42.7 | ||
| Turnout | 4,757 | 71.6 | ||
| Conservative hold | ||||
Iver
| Party | Candidate | Votes | % | |
|---|---|---|---|---|
| Liberal Democrats | Alex Oxley | 2,011 | 52.6 | |
| Conservative | Kathleen Webber | 1,811 | 47.4 | |
| Majority | 200 | 5.2 | ||
| Turnout | 3,822 | 63.7 | ||
| Liberal Democrats hold | ||||
Ivinghoe
| Party | Candidate | Votes | % | |
|---|---|---|---|---|
| Liberal Democrats | Avril Davies | 2,722 | 53.0 | |
| Conservative | Terence Jones | 2,411 | 47.0 | |
| Majority | 311 | 6.0 | ||
| Turnout | 5,133 | 73.3 | ||
| Liberal Democrats hold | ||||
Marlow
| Party | Candidate | Votes | % | |
|---|---|---|---|---|
| Conservative | Douglas Anson | 4,040 | 23.9 | |
| Conservative | Frank Sweatman | 3,532 | 20.9 | |
| Liberal Democrats | Maurice Oram | 3,112 | 18.4 | |
| Liberal Democrats | James Campbell | 2,965 | 17.6 | |
| Labour | Janet Pritchard | 1,313 | 7.8 | |
| Labour | Paul Mansell | 1,241 | 7.4 | |
| UKIP | Diana Davis | 675 | 7.4 | |
| Majority | 420 | 2.5 | ||
| Turnout | 16,878 | 68.2 | ||
| Conservative hold | ||||
| Conservative hold | ||||
Penn, Coleshill & Holmer Green
| Party | Candidate | Votes | % | |
|---|---|---|---|---|
| Conservative | Francis Robinson | 2,782 | 59.7 | |
| Liberal Democrats | Deborah Williams | 1,246 | 26.8 | |
| Labour | Michael Cole | 629 | 13.5 | |
| Majority | 1,536 | 32.9 | ||
| Turnout | 4,657 | 69.0 | ||
| Conservative hold | ||||
Ryemead, Tylers Green & Loudwater
| Party | Candidate | Votes | % | |
|---|---|---|---|---|
| Conservative | Elizabeth Lay | 2,908 | 24.6 | |
| Conservative | David Shakespeare | 2,781 | 23.5 | |
| Liberal Democrats | Ian Forbes | 1,875 | 15.9 | |
| Liberal Democrats | Trevor Snaith | 1,612 | 13.6 | |
| Labour | Clare Martens | 1,350 | 11.4 | |
| Labour | Peter Morris | 1,303 | 11.0 | |
| Majority | 906 | 7.6 | ||
| Turnout | 11,829 | 60.7 | ||
| Conservative hold | ||||
| Conservative hold | ||||
Stoke Poges & Farnham Common
| Party | Candidate | Votes | % | |
|---|---|---|---|---|
| Conservative | Rodney Royston | 2,605 | 62.1 | |
| Liberal Democrats | Eamonn Lyons | 844 | 20.1 | |
| Labour | Lindsey Gillan | 743 | 17.7 | |
| Majority | 1,761 | 42.0 | ||
| Turnout | 4,192 | 66.0 | ||
| Conservative hold | ||||
Stokenchurch, Radnage & West Wycombe
| Party | Candidate | Votes | % | |
|---|---|---|---|---|
| Conservative | Frank Downes | 2,369 | 54.0 | |
| Liberal Democrats | Rosemary Eames | 1,114 | 25.4 | |
| Labour | Samuel Trueman | 902 | 20.6 | |
| Majority | 1,255 | 28.6 | ||
| Turnout | 4,385 | 63.4 | ||
| Conservative hold | ||||
Taplow, Dorney & Lent Rise
| Party | Candidate | Votes | % | |
|---|---|---|---|---|
| Conservative | Peter Smith | 2,018 | 57.9 | |
| Liberal Democrats | Christopher Tucker | 1,469 | 42.1 | |
| Majority | 549 | 15.8 | ||
| Turnout | 3,487 | 61.2 | ||
| Conservative hold | ||||
Terriers & Amersham Hill
| Party | Candidate | Votes | % | |
|---|---|---|---|---|
| Conservative | Valerie Letheren | 1,784 | 47.2 | |
| Labour | Kiern Moran | 1,004 | 26.6 | |
| Liberal Democrats | Wendy Guy | 991 | 26.2 | |
| Majority | 780 | 20.6 | ||
| Turnout | 3,779 | 61.7 | ||
| Conservative hold | ||||
Thames
| Party | Candidate | Votes | % | |
|---|---|---|---|---|
| Conservative | Michael Appleyard | 4,539 | 28.7 | |
| Conservative | David Watson | 4,052 | 25.6 | |
| Liberal Democrats | Brian Pollock | 2,843 | 18.0 | |
| Liberal Democrats | Jeff Herschel | 2,808 | 17.7 | |
| Labour | Michael Phelan | 1,592 | 10.1 | |
| Majority | 1,209 | 7.6 | ||
| Turnout | 15,834 | 66.5 | ||
| Conservative hold | ||||
| Conservative hold | ||||
The Chalfonts & Seer Green
| Party | Candidate | Votes | % | |
|---|---|---|---|---|
| Conservative | Pamela Bacon | 5,514 | 31.5 | |
| Conservative | Martin Tett | 4,882 | 27.9 | |
| Liberal Democrats | Michael Meakin | 2,578 | 14.7 | |
| Liberal Democrats | Peter Nowell | 2,535 | 14.5 | |
| Labour | Sarah Hutchison | 1,088 | 6.2 | |
| Labour | Gearoid De Barra | 922 | 5.3 | |
| Majority | 2,304 | 13.2 | ||
| Turnout | 17,519 | 67.2 | ||
| Conservative hold | ||||
| Conservative hold | ||||
The Risboroughs
| Party | Candidate | Votes | % | |
|---|---|---|---|---|
| Conservative | Dennis Green | 2,277 | 53.9 | |
| Liberal Democrats | Nelson Bathurst | 1,231 | 29.2 | |
| Labour | William Dore | 713 | 16.9 | |
| Majority | 1,046 | 24.7 | ||
| Turnout | 4,221 | 67.2 | ||
| Conservative hold | ||||
Wendover & Halton
| Party | Candidate | Votes | % | |
|---|---|---|---|---|
| Conservative | Marion Clayton | 1,984 | 48.9 | |
| Liberal Democrats | Christopher Peeler | 1,547 | 38.1 | |
| Labour | Robert Pile | 458 | 11.3 | |
| Aylesbury Residents Action | Dorothy Price | 70 | 1.7 | |
| Majority | 437 | 10.8 | ||
| Turnout | 4,059 | 67.1 | ||
| Conservative hold | ||||
Wing
| Party | Candidate | Votes | % | |
|---|---|---|---|---|
| Conservative | Quintin Ings-Chambers | 2,323 | 55.9 | |
| Liberal Democrats | Mark Watson | 1,832 | 44.1 | |
| Majority | 491 | 11.8 | ||
| Turnout | 4,155 | 71.3 | ||
| Conservative hold | ||||
Winslow
| Party | Candidate | Votes | % | |
|---|---|---|---|---|
| Conservative | David Rowlands | 2,841 | 62.2 | |
| Liberal Democrats | Harold Newman | 1,725 | 37.8 | |
| Majority | 1,116 | 70.1 | ||
| Turnout | 4,566 | 70.1 | ||
| Conservative hold | ||||
References
| Buckinghamshire Council | |
|---|---|
| Buckinghamshire County Council | |
| Milton Keynes Council | |
| Aylesbury Vale District Council | |
| Chiltern District Council |
|
| South Bucks District Council |
|
| Wycombe District Council |
|
| |
| County council elections |
|
|---|---|
| Unitary authorities |
|
| District councils (Northern Ireland) | |
| Sui generis |
|
| Mayoral elections |
|
| |