2017 Newport City Council election
Elections to Newport City Council were held on 3 May 2017[1] along with elections to the other 21 local authorities in Wales, community council elections in Wales and 2017 United Kingdom local elections.
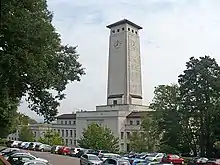
Newport Civic Centre
Councillors elected in this election will serve a five-year term due to new Welsh Government policy.[2]
The previous election took place on 3 May 2012.
The next full election will take place in May 2022.
Election results: overview
| Party | Seats | Gains | Losses | Net gain/loss | Seats % | Votes % | Votes | +/− | |
|---|---|---|---|---|---|---|---|---|---|
| Labour | 31 | -6 | 62.0 | 36.1 | 15,869 | -12.1 | |||
| Conservative | 12 | +2 | 24.0 | 32.0 | 14,072 | +3.3 | |||
| Newport Independents | 4 | +4 | 8.0 | 10.2 | 4,466 | +10.2 | |||
| Liberal Democrats | 2 | +1 | 4.0 | 9.4 | 4,115 | -3.6 | |||
| Independent | 1 | -1 | 2.0 | 3.0 | 1,322 | -1.8 | |||
| Plaid Cymru | 0 | 0 | 0.0 | 4.1 | 1,799 | 0.0 | |||
| Green | 0 | 0 | 0.0 | 1.9 | 814 | +1.9 | |||
| UKIP | 0 | 0 | 0.0 | 3.5 | 1,534 | +3.5 | |||
| Total | 50 | 43,991 | |||||||
Ward results
Vote share changes compared with corresponding 2012 election.
Allt-yr-yn
| Party | Candidate | Votes | % | ±% | |
|---|---|---|---|---|---|
| Conservative | Matthew Evans | 1,731 | |||
| Conservative | David Fouweather | 1,692 | |||
| Conservative | Charles Ferris | 1,610 | |||
| Labour | John Harris | 985 | |||
| Labour | Kassim Hayat | 841 | |||
| Labour | John Reynolds | 840 | |||
| Plaid Cymru | Jonathan Clark | 332 | |||
| Liberal Democrats | Sue Davies | 331 | |||
| Liberal Democrats | Chloe Elding | 244 | |||
| Liberal Democrats | John Miller | 184 | |||
| Majority | |||||
| Turnout | 8,790 | ||||
| Conservative hold | Swing | ||||
| Conservative hold | Swing | ||||
| Conservative hold | Swing | ||||
Alway
| Party | Candidate | Votes | % | ±% | |
|---|---|---|---|---|---|
| Labour | Raymond Truman | 976 | |||
| Labour | Debbie Harvey | 931 | |||
| Labour | John Guy | 911 | |||
| Conservative | Carol Wallis | 516 | |||
| Conservative | Amna Arshid | 400 | |||
| Newport Independents | Dave Jones | 355 | |||
| Plaid Cymru | Cath Wixcey | 195 | |||
| Liberal Democrats | Liam Biaggi | 171 | |||
| Majority | |||||
| Turnout | 4,455 | ||||
| Labour hold | Swing | ||||
| Labour hold | Swing | ||||
| Labour hold | Swing | ||||
Beechwood
| Party | Candidate | Votes | % | ±% | |
|---|---|---|---|---|---|
| Labour | Deb Davies | 978 | |||
| Labour | Graham Berry | 936 | |||
| Labour | Mark Spencer | 875 | |||
| Liberal Democrats | Tony Biaggi | 488 | |||
| Liberal Democrats | Sarah Lockyer | 447 | |||
| Liberal Democrats | Pete Brown | 444 | |||
| Conservative | Georgina Webb | 420 | |||
| Conservative | Michael Weekes | 378 | |||
| UKIP | Tim Price | 260 | |||
| Newport Independents | Julie Price | 213 | |||
| Majority | |||||
| Turnout | 6,510 | ||||
| Labour gain from Liberal Democrats | Swing | ||||
| Labour gain from Liberal Democrats | Swing | ||||
| Labour gain from Liberal Democrats | Swing | ||||
Bettws
| Party | Candidate | Votes | % | ±% | |
|---|---|---|---|---|---|
| Newport Independents | Kevin Whitehead | 897 | |||
| Newport Independents | Janet Cleverly | 816 | |||
| Newport Independents | Jason Jordan | 744 | |||
| Labour | Sandra Daniell | 541 | |||
| Labour | Chris Jarvis | 467 | |||
| Labour | Philip Saunders | 411 | |||
| Conservative | Lewis Williams | 212 | |||
| Conservative | Timothy Masters | 181 | |||
| Conservative | Huw Davies | 178 | |||
| Green | Peter Varley | 106 | |||
| Majority | |||||
| Turnout | 4,553 | ||||
| Newport Independents hold | Swing | ||||
| Newport Independents gain from Labour | Swing | ||||
| Newport Independents gain from Labour | Swing | ||||
Caerleon
| Party | Candidate | Votes | % | ±% | |
|---|---|---|---|---|---|
| Labour | Gail Giles | 1,336 | |||
| Conservative | Joan Watkins | 1,282 | |||
| Labour | Jason Hughes | 1,166 | |||
| Conservative | Michael Enea | 1,095 | |||
| Conservative | Richard Andrews | 1,079 | |||
| Labour | Mike Singleton | 1,065 | |||
| Liberal Democrats | Paul l'Allier | 392 | |||
| Liberal Democrats | Andy White | 376 | |||
| UKIP | Stan Edwards | 309 | |||
| Liberal Democrats | Laura Ricketts | 239 | |||
| Majority | |||||
| Turnout | 8,339 | ||||
| Labour gain from {{{loser}}} | Swing | ||||
| Labour hold | Swing | ||||
| Conservative gain from Labour | Swing | ||||
Gaer
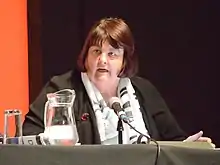
Debbie Wilcox, Newport City Council leader since 2016
| Party | Candidate | Votes | % | ±% | |
|---|---|---|---|---|---|
| Labour | Stephen Marshall | 1,019 | |||
| Labour | Mark Whitcutt | 994 | |||
| Labour | Deborah Wilcox | 991 | |||
| Conservative | Lloyd Walsh | 847 | |||
| Conservative | Miriam Shwartz | 778 | |||
| Conservative | Saleh Baqi | 672 | |||
| Newport Independents | Rhys Richards | 324 | |||
| Liberal Democrats | Paul Woodcock-Jones | 199 | |||
| Majority | |||||
| Turnout | 5,824 | ||||
| Labour gain from {{{loser}}} | Swing | ||||
| Labour hold | Swing | ||||
| Labour gain from {{{loser}}} | Swing | ||||
Graig
| Party | Candidate | Votes | % | ±% | |
|---|---|---|---|---|---|
| Conservative | David Williams | 1,026 | |||
| Conservative | Margaret Cornelious | 976 | |||
| Labour | Victoria Cox-Wall | 825 | |||
| Labour | Paul Davies | 758 | |||
| Liberal Democrats | Nathan Tarr | 194 | |||
| Green | Issica Baron | 153 | |||
| Majority | |||||
| Turnout | 3,932 | ||||
| Conservative hold | Swing | ||||
| Conservative hold | Swing | ||||
Langstone
| Party | Candidate | Votes | % | ±% | |
|---|---|---|---|---|---|
| Conservative | Ray Mogford | 1,036 | |||
| Conservative | William Routley | 913 | |||
| Liberal Democrats | Pam Bellew | 292 | |||
| Liberal Democrats | David Hando | 238 | |||
| Labour | Gareth Pratt | 219 | |||
| Labour | Alan Speight | 189 | |||
| Majority | |||||
| Turnout | 2,887 | ||||
| Conservative hold | Swing | ||||
| Conservative gain from {{{loser}}} | Swing | ||||
Liswerry
| Party | Candidate | Votes | % | ±% | |
|---|---|---|---|---|---|
| Labour | Ken Critchley | 1,106 | |||
| Labour | Roger Jeavons | 1,043 | |||
| Labour | John Richards | 874 | |||
| Independent | Allan Morris | 828 | |||
| Labour | Farzina Hussain | 764 | |||
| Conservative | Carl Tucker | 528 | |||
| Conservative | Nicholas Clark | 492 | |||
| UKIP | James Peterson | 461 | |||
| UKIP | Andrew Sterry | 455 | |||
| Conservative | Dave Cox | 452 | |||
| Conservative | Richard Hill | 388 | |||
| UKIP | Patrina Smith | 330 | |||
| Plaid Cymru | Cam Wixcey | 198 | |||
| Majority | |||||
| Turnout | 7,919 | ||||
| Labour hold | Swing | ||||
| Labour gain from {{{loser}}} | Swing | ||||
| Labour gain from {{{loser}}} | Swing | ||||
| Independent gain from Labour | Swing | ||||
Llanwern
| Party | Candidate | Votes | % | ±% | |
|---|---|---|---|---|---|
| Conservative | Martyn Kellaway | 954 | |||
| Labour | John Davies | 255 | |||
| Majority | |||||
| Turnout | 1,209 | ||||
| Conservative hold | Swing | ||||
Malpas
| Party | Candidate | Votes | % | ±% | |
|---|---|---|---|---|---|
| Labour | Jane Mudd | 979 | |||
| Labour | James Clarke | 937 | |||
| Labour | David Mayer | 914 | |||
| Conservative | Michael Brunnock | 878 | |||
| Conservative | David Gapper-Hampson | 699 | |||
| Conservative | Jim Hampson | 673 | |||
| Newport Independents | Jonathan Cocks | 502 | |||
| Newport Independents | Rachel Reaney | 302 | |||
| Green | Pippa Bartolotti | 283 | |||
| Newport Independents | Gavin Phillips | 283 | |||
| Green | Malcolm Degroot | 161 | |||
| Liberal Democrats | Peter Davies | 99 | |||
| Majority | |||||
| Turnout | 6,710 | ||||
| Labour gain from {{{loser}}} | Swing | ||||
| Labour hold | Swing | ||||
| Labour hold | Swing | ||||
Marshfield
| Party | Candidate | Votes | % | ±% | |
|---|---|---|---|---|---|
| Conservative | Richard White | 853 | |||
| Conservative | Tom Suller | 801 | |||
| Labour | Tony Boswell | 491 | |||
| Labour | Ann Picton | 437 | |||
| Liberal Democrats | Liz Newton | 236 | |||
| Green | Lim Jones | 188 | |||
| Majority | |||||
| Turnout | 3,006 | ||||
| Conservative hold | Swing | ||||
| Conservative hold | Swing | ||||
Pillgwenlly
| Party | Candidate | Votes | % | ±% | |
|---|---|---|---|---|---|
| Labour | Ibrahim Hayat | 758 | |||
| Labour | Tracey Holyoake | 757 | |||
| Independent | Omar Ali | 494 | |||
| Plaid Cymru | Khalilur Rahman | 288 | |||
| Conservative | Zafar Ismail | 238 | |||
| Conservative | Firdaus Asghar | 205 | |||
| Plaid Cymru | Simon Coopey | 197 | |||
| Majority | |||||
| Turnout | 2,937 | ||||
| Labour hold | Swing | ||||
| Labour hold | Swing | ||||
Ringland
| Party | Candidate | Votes | % | ±% | |
|---|---|---|---|---|---|
| Labour | Malcolm Linton | 911 | |||
| Labour | Laura Lacey | 703 | |||
| Labour | Rehmaan Hayat | 613 | |||
| Newport Independents | Rocky Davies | 430 | |||
| Conservative | Christine Smith | 405 | |||
| Newport Independents | Ray Lord | 386 | |||
| UKIP | Mike Ford | 368 | |||
| Conservative | Muhammad Tariq | 283 | |||
| Conservative | Saeed Zafar | 210 | |||
| Liberal Democrats | Pierre l'Allier | 106 | |||
| Majority | |||||
| Turnout | 4,415 | ||||
| Labour hold | Swing | ||||
| Labour gain from {{{loser}}} | Swing | ||||
| Labour hold | Swing | ||||
Rogerstone
| Party | Candidate | Votes | % | ±% | |
|---|---|---|---|---|---|
| Conservative | Valerie Dudley | 1,281 | |||
| Labour | Yvonne Forsey | 1,258 | |||
| Newport Independents | Chris Evans | 1,215 | |||
| Labour | Kath Hopkins | 1,161 | |||
| Conservative | Dean Jenkins | 1,111 | |||
| Labour | Sally Mlewa | 1,089 | |||
| Newport Independents | Andrew Collingbourne | 1,002 | |||
| Conservative | Ganesh Sukul | 910 | |||
| Liberal Democrats | Susan Cocks | 252 | |||
| Plaid Cymru | Anthony Salkeld | 206 | |||
| Majority | |||||
| Turnout | 9,485 | ||||
| Conservative gain from Labour | Swing | ||||
| Labour gain from {{{loser}}} | Swing | ||||
| Newport Independents gain from Labour | Swing | ||||
St Julians
| Party | Candidate | Votes | % | ±% | |
|---|---|---|---|---|---|
| Liberal Democrats | Carmel Townsend | 1,011 | |||
| Labour | Phil Hourahine | 889 | |||
| Liberal Democrats | Holly Townsend | 825 | |||
| Labour | Roy McCabe | 748 | |||
| Labour | Funmi Obilanade | 700 | |||
| Liberal Democrats | Ryan Jones | 654 | |||
| Conservative | Vicky Howells-Cook | 453 | |||
| Conservative | Marie Jermyn | 387 | |||
| Plaid Cymru | Chris Priest | 250 | |||
| Majority | |||||
| Turnout | 5,917 | ||||
| Liberal Democrats gain from {{{loser}}} | Swing | ||||
| Labour gain from {{{loser}}} | Swing | ||||
| Liberal Democrats hold | Swing | ||||
Shaftesbury
| Party | Candidate | Votes | % | ±% | |
|---|---|---|---|---|---|
| Labour | Paul Cockeram | 619 | |||
| Labour | Herbie Thomas | 560 | |||
| Conservative | Carol Bader | 439 | |||
| Conservative | Michael Duncan | 337 | |||
| Newport Independents | David Rice | 185 | |||
| UKIP | Joe Crocker | 136 | |||
| Newport Independents | Khushbir Bhullar | 119 | |||
| Majority | |||||
| Turnout | 2,395 | ||||
| Labour hold | Swing | ||||
| Labour hold | Swing | ||||
Stow Hill
| Party | Candidate | Votes | % | ±% | |
|---|---|---|---|---|---|
| Labour | Kate Thomas | 589 | |||
| Labour | Miqdad al-Nuaimi | 561 | |||
| Conservative | Luke Evetts | 345 | |||
| Conservative | Nicolas Webb | 326 | |||
| Newport Independents | Tom Stanger | 148 | |||
| Newport Independents | David McLean | 143 | |||
| Plaid Cymru | Rhys ab Elis | 96 | |||
| Majority | |||||
| Turnout | 2,208 | ||||
| Labour gain from {{{loser}}} | Swing | ||||
| Labour gain from {{{loser}}} | Swing | ||||
Tredegar Park
| Party | Candidate | Votes | % | ±% | |
|---|---|---|---|---|---|
| Labour | Trevor Watkins | 295 | |||
| Conservative | Wayne Cresswell | 257 | |||
| Newport Independents | Jan Flanagan | 197 | |||
| Plaid Cymru | Morgan Bowler-Brown | 111 | |||
| Majority | |||||
| Turnout | 860 | ||||
| Labour gain from {{{loser}}} | Swing | ||||
Victoria
| Party | Candidate | Votes | % | ±% | |
|---|---|---|---|---|---|
| Labour | Chris Jenkins | 840 | |||
| Labour | Majid Rahman | 795 | |||
| Conservative | Saima Mujahid | 371 | |||
| Liberal Democrats | Mike Hamilton | 344 | |||
| Conservative | Mubarak Ali | 336 | |||
| Liberal Democrats | Jeff Evans | 333 | |||
| Plaid Cymru | Trefor Puw | 123 | |||
| Green | Mirka Virtanen | 84 | |||
| Majority | |||||
| Turnout | 3,226 | ||||
| Labour gain from {{{loser}}} | Swing | ||||
| Labour gain from {{{loser}}} | Swing | ||||
References
- Local Election Results 2017 - National Assembly for Wales, Welsh Assembly, 2017
- Drakeford, Mark. "Written Statement - Local Elections and Electoral Arrangements". Retrieved 2019-05-03.
- Teale, Andrew. "Local Election Results 2017: Newport". Retrieved 2019-05-01.

| Mayoral elections | |
|---|---|
| County councils (England) |
|
| Unitary authorities (England) | |
| Other English councils | |
| Unitary authorities (Scotland) |
|
| Unitary authorities (Wales) |
|
This article is issued from Wikipedia. The text is licensed under Creative Commons - Attribution - Sharealike. Additional terms may apply for the media files.