California's 29th congressional district
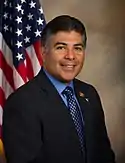
California's 29th congressional district is a congressional district in the U.S. state of California based in the north central San Fernando Valley, it includes the city of San Fernando as well as the Los Angeles communities of Van Nuys, Pacoima, Arleta, Panorama City, Sylmar and parts of Sun Valley and North Hollywood. The district is represented by Democrat Tony Cárdenas.
| California's 29th congressional district | |||
|---|---|---|---|
.tif.png.webp) California's 29th congressional district since January 3, 2013 | |||
| Representative |
| ||
| Population (2019) | 717,659 | ||
| Median household income | $60,970[1] | ||
| Ethnicity | |||
| Cook PVI | D+29[3] | ||
Competitiveness
In statewide races
| Election results from statewide races | ||
|---|---|---|
| Year | Office | Results |
| 1990 | Governor[4] | Feinstein 74.3% - 22.2% |
| 1992 | President[5] | Clinton 66.3% - 20.2% |
| Senator[6] | Boxer 67.7% - 27.4% | |
| Senator (Special)[7] | Feinstein 72.6% - 23.6% | |
| 1994 | Governor[8] | Brown 55.6% - 41.1% |
| Senator[9] | Feinstein 69.4% - 26.0% | |
| 1996 | President[10] | Clinton 66.5% - 23.5% |
| 1998 | Governor[11] | Davis 73.8% - 22.6% |
| Senator[12] | Boxer 70.9% - 26.7% | |
| 2000 | President[13] | Gore 72.1% - 22.3% |
| Senator[14] | Feinstein 70.5% - 21.2% | |
| 2002 | Governor[15] | Davis 52.2% - 38.7% |
| 2003 | Recall[16][17] | |
| Schwarzenegger 47.1% - 33.6% | ||
| 2004 | President[18] | Kerry 61.2% - 37.4% |
| Senator[19] | Boxer 63.8% - 31.4% | |
| 2006 | Governor[20] | Schwarzenegger 50.3% - 44.4% |
| Senator[21] | Feinstein 64.0% - 30.7% | |
| 2008 | President[22] | Obama 67.6% - 30.4% |
| 2010 | Governor[23] | Brown 61.0% - 34.5% |
| Senator[24] | Boxer 60.7% - 34.8% | |
| 2012 | President[25] | Obama 77.0% - 20.5% |
| Senator[26] | Feinstein 77.8% - 22.2% | |
| 2014 | Governor[27] | Brown 73.8% – 26.2% |
| 2016 | President[28] | Clinton 77.7% - 16.8% |
| Senator[29] | Harris 53.9% - 47.0% | |
| 2018 | Governor[30] | Newsom 77.8% – 22.2% |
| Senator[31] | Feinstein 55.0% – 45.0% | |
| 2020 | President[32] | Biden 74.1% - 23.7% |
List of members representing the district

.jpg.webp)
.tif.png.webp)
Election results
|
1952 • 1954 • 1956 • 1958 • 1960 • 1962 • 1964 • 1966 • 1968 • 1970 • 1972 • 1974 • 1976 • 1978 • 1980 • 1982 • 1984 • 1986 • 1988 • 1990 • 1992 • 1994 • 1996 • 1998 • 2000 • 2002 • 2004 • 2006 • 2010 • 2012 • 2014 • 2016 • 2018 • 2020 |
1952
| Party | Candidate | Votes | % | |
|---|---|---|---|---|
| Republican | John J. Phillips (Incumbent) | 73,144 | 100.0 | |
| Republican hold | ||||
1954
| Party | Candidate | Votes | % | |
|---|---|---|---|---|
| Republican | John J. Phillips (Incumbent) | 42,420 | 58.0 | |
| Democratic | Bruce Shangle | 30,781 | 42.0 | |
| Total votes | 73,201 | 100.0 | ||
| Republican hold | ||||
1956
| Party | Candidate | Votes | % | |||
|---|---|---|---|---|---|---|
| Democratic | Dalip Singh Saund | 54,989 | 51.5 | |||
| Republican | Jacqueline Cochran Odlum | 51,690 | 48.5 | |||
| Total votes | 106,679 | 100.0 | ||||
| Democratic gain from Republican | ||||||
1958
| Party | Candidate | Votes | % | |
|---|---|---|---|---|
| Democratic | Dalip Singh Saund (Incumbent) | 64,518 | 62.4 | |
| Republican | John Babbage | 38,899 | 37.6 | |
| Total votes | 103,417 | 100.0 | ||
| Democratic hold | ||||
1960
| Party | Candidate | Votes | % | |
|---|---|---|---|---|
| Democratic | Dalip Singh Saund (Incumbent) | 76,139 | 57.1 | |
| Republican | Charles H. Jameson | 57,319 | 42.9 | |
| Total votes | 133,458 | 100.0 | ||
| Democratic hold | ||||
1962
| Party | Candidate | Votes | % | |
|---|---|---|---|---|
| Democratic | George Brown, Jr. | 73,740 | 55.7 | |
| Republican | H. L. Richardson, Jr. | 58,760 | 44.3 | |
| Total votes | 132,500 | 100.0 | ||
| Democratic hold | ||||
1964
| Party | Candidate | Votes | % | |
|---|---|---|---|---|
| Democratic | George Brown, Jr. (Incumbent) | 90,208 | 58.6 | |
| Republican | Charles J. Farrington, Jr. | 63,836 | 41.4 | |
| Total votes | 154,044 | 100.0 | ||
| Democratic hold | ||||
1966
| Party | Candidate | Votes | % | |
|---|---|---|---|---|
| Democratic | George Brown, Jr. (Incumbent) | 69,115 | 51.1 | |
| Republican | Bill Orozco | 66,079 | 48.9 | |
| Total votes | 135,194 | 100.0 | ||
| Democratic hold | ||||
1968
| Party | Candidate | Votes | % | |
|---|---|---|---|---|
| Democratic | George Brown, Jr. (Incumbent) | 74,807 | 52.3 | |
| Republican | Bill Orozco | 68,213 | 47.7 | |
| Total votes | 143,020 | 100.0 | ||
| Democratic hold | ||||
1970
| Party | Candidate | Votes | % | |
|---|---|---|---|---|
| Democratic | George E. Danielson | 71,308 | 62.6 | |
| Republican | Tom McMann | 42,620 | 37.4 | |
| Total votes | 113,928 | 100.0 | ||
| Democratic hold | ||||
1972
| Party | Candidate | Votes | % | |
|---|---|---|---|---|
| Democratic | George E. Danielson (Incumbent) | 91,553 | 62.8 | |
| Republican | Richard E. Ferraro | 48,814 | 33.5 | |
| Peace and Freedom | John W. Blaine | 5,455 | 3.7 | |
| Total votes | 145,822 | 100.0 | ||
| Democratic hold | ||||
1974
| Party | Candidate | Votes | % | |
|---|---|---|---|---|
| Democratic | Augustus F. Hawkins (Incumbent) | 45,977 | 100.0 | |
| Democratic hold | ||||
1976
| Party | Candidate | Votes | % | |
|---|---|---|---|---|
| Democratic | Augustus F. Hawkins (Incumbent) | 82,515 | 85.5 | |
| Republican | Michael D. Germonprez | 10,852 | 11.2 | |
| Independent | Sheila Leburg | 3,235 | 3.3 | |
| Total votes | 96,602 | 100.0 | ||
| Democratic hold | ||||
1978
| Party | Candidate | Votes | % | |
|---|---|---|---|---|
| Democratic | Augustus F. Hawkins (Incumbent) | 65,214 | 85.0 | |
| Republican | Uriah J. Fields | 11,512 | 15.0 | |
| Total votes | 76,726 | 100.0 | ||
| Democratic hold | ||||
1980
| Party | Candidate | Votes | % | |
|---|---|---|---|---|
| Democratic | Augustus F. Hawkins (Incumbent) | 80,095 | 86.1 | |
| Republican | Michael Arthur Hirt | 10,282 | 11.1 | |
| Libertarian | Earl Smith | 2,622 | 2.8 | |
| Total votes | 92,999 | 100.0 | ||
| Democratic hold | ||||
1982
| Party | Candidate | Votes | % | |
|---|---|---|---|---|
| Democratic | Augustus F. Hawkins (Incumbent) | 97,028 | 79.8 | |
| Republican | Milton R. Mackaig | 24,568 | 20.2 | |
| Total votes | 121,596 | 100.0 | ||
| Democratic hold | ||||
1984
| Party | Candidate | Votes | % | |
|---|---|---|---|---|
| Democratic | Augustus F. Hawkins (Incumbent) | 108,777 | 86.6 | |
| Republican | Echo Y. Goto | 16,781 | 13.4 | |
| Total votes | 125,558 | 100.0 | ||
| Democratic hold | ||||
1986
| Party | Candidate | Votes | % | |
|---|---|---|---|---|
| Democratic | Augustus F. Hawkins (Incumbent) | 78,132 | 84.6 | |
| Republican | John Van de Brooke | 13,432 | 14.5 | |
| Libertarian | Waheed R. Boctor | 851 | 0.9 | |
| Total votes | 92,415 | 100.0 | ||
| Democratic hold | ||||
1988
| Party | Candidate | Votes | % | |
|---|---|---|---|---|
| Democratic | Augustus F. Hawkins (Incumbent) | 88,169 | 82.8 | |
| Republican | Reuben D. Franco | 14,543 | 13.7 | |
| Libertarian | Gregory P. Gilmore | 3,724 | 3.5 | |
| Total votes | 105,436 | 100.0 | ||
| Democratic hold | ||||
1990
| Party | Candidate | Votes | % | |
|---|---|---|---|---|
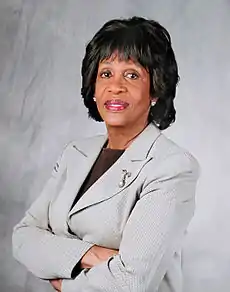
| Democratic | Maxine Waters | 51,350 | 79.4 | |
| Republican | Bill DeWitt | 12,054 | 18.6 | |
| Libertarian | Waheed R. Boctor | 1,268 | 2.0 | |
| Total votes | 64,672 | 100.0 | ||
| Democratic hold | ||||
1992
| Party | Candidate | Votes | % | |
|---|---|---|---|---|
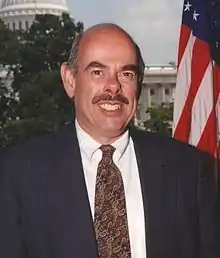
| Democratic | Henry Waxman (Incumbent) | 160,312 | 61.3 | |
| Republican | Mark Robbins | 67,141 | 25.7 | |
| Independent | David Davis | 15,445 | 5.9 | |
| Peace and Freedom | Susan C. Davies | 13,888 | 5.3 | |
| Libertarian | Felix Tsvi Rogin | 4,699 | 1.8 | |
| Independent | Vann (write-in) | 1 | 0.0 | |
| Total votes | 261,486 | 100.0 | ||
| Democratic hold | ||||
1994
| Party | Candidate | Votes | % | |
|---|---|---|---|---|
| Democratic | Henry Waxman (Incumbent) | 129,413 | 66.1 | |
| Republican | Paul Stepanek | 53,801 | 28.1 | |
| Libertarian | Mike Binkley | 7,162 | 3.8 | |
| Total votes | 190,376 | 100.0 | ||
| Democratic hold | ||||
1996
| Party | Candidate | Votes | % | |
|---|---|---|---|---|
| Democratic | Henry Waxman (Incumbent) | 145,278 | 67.7 | |
| Republican | Paul Stepanek | 52,857 | 24.6 | |
| Peace and Freedom | John Daley | 8,819 | 4.1 | |
| Libertarian | Mike Binkley | 4,766 | 2.2 | |
| Natural Law | Brian Rees | 3,097 | 1.4 | |
| Total votes | 214,817 | 100.0 | ||
| Democratic hold | ||||
1998
| Party | Candidate | Votes | % | |
|---|---|---|---|---|
| Democratic | Henry Waxman (Incumbent) | 131,561 | 73.9 | |
| Republican | Mike Gottlieb | 40,282 | 22.6 | |
| Libertarian | Mike Binkley | 3,534 | 2.0 | |
| Natural Law | Karen Blasdell-Wilkinson | 2,717 | 1.5 | |
| Total votes | 178,094 | 100.0 | ||
| Democratic hold | ||||
2000
| Party | Candidate | Votes | % | |
|---|---|---|---|---|
| Democratic | Henry Waxman (Incumbent) | 180,295 | 75.7 | |
| Republican | Jim Scileppi | 45,784 | 19.3 | |
| Libertarian | Jack Anderson | 7,944 | 3.3 | |
| Natural Law | Bruce Currivan | 4,178 | 1.7 | |
| Total votes | 238,201 | 100.0 | ||
| Democratic hold | ||||
2002
| Party | Candidate | Votes | % | |
|---|---|---|---|---|
| Democratic | Adam Schiff (Incumbent) | 76,036 | 62.6 | |
| Republican | Jim Scileppi | 40,676 | 33.4 | |
| Libertarian | Ted Brown | 4,889 | 4.0 | |
| Total votes | 121,541 | 100.0 | ||
| Democratic hold | ||||
2004
| Party | Candidate | Votes | % | |
|---|---|---|---|---|
| Democratic | Adam Schiff (Incumbent) | 133,670 | 64.7 | |
| Republican | Harry Frank Scolinos | 62,871 | 30.4 | |
| Green | Philip Koebel | 5,715 | 2.7 | |
| Libertarian | Ted Brown | 4,570 | 2.2 | |
| Independent | John Burton (write-in) | 6 | 0.0 | |
| Total votes | 206,832 | 100.0 | ||
| Democratic hold | ||||
2006
| Party | Candidate | Votes | % | |
|---|---|---|---|---|
| Democratic | Adam Schiff (Incumbent) | 91,014 | 63.5 | |
| Republican | William J. Bodell | 39,321 | 27.5 | |
| Green | William M. Paparian | 8,197 | 5.7 | |
| Peace and Freedom | Lynda L. Llamas | 2,599 | 1.8 | |
| Libertarian | Jim Keller | 2,258 | 1.5 | |
| Independent | John Burton (write-in) | 15 | 0.0 | |
| Total votes | 143,404 | 100.0 | ||
| Democratic hold | ||||
2008
| Party | Candidate | Votes | % | |
|---|---|---|---|---|
| Democratic | Adam Schiff (Incumbent) | 146,198 | 68.9 | |
| Republican | Charles Hahn | 56,727 | 26.7 | |
| Libertarian | Alan Pyeatt | 9,219 | 4.4 | |
| Democratic hold | ||||
2010
| Party | Candidate | Votes | % | |
|---|---|---|---|---|
| Democratic | Adam Schiff (Incumbent) | 104,374 | 64.8 | |
| Republican | John P. Colbert | 51,534 | 32.0 | |
| Libertarian | William P. Cushing | 5,218 | 3.2 | |
| Democratic hold | ||||
2012
| Party | Candidate | Votes | % | |
|---|---|---|---|---|
| Democratic | Tony Cardenas | 111,287 | 74.1 | |
| No party preference | David R. Hernandez | 38,994 | 25.9 | |
| Total votes | 150,281 | 100.0 | ||
| Democratic hold | ||||
2014
| Party | Candidate | Votes | % | |
|---|---|---|---|---|
| Democratic | Tony Cardenas (Incumbent) | 50,096 | 74.6 | |
| Republican | William O'Callaghan Leader | 17,045 | 25.4 | |
| Total votes | 67,141 | 100.0 | ||
| Democratic hold | ||||
2016
| Party | Candidate | Votes | % | |
|---|---|---|---|---|
| Democratic | Tony Cardenas (Incumbent) | 128,407 | 74.7 | |
| Democratic | Richard Alarcon | 43,417 | 25.3 | |
| Total votes | 171,824 | 100.0 | ||
| Democratic hold | ||||
2018
| Party | Candidate | Votes | % | |
|---|---|---|---|---|
| Democratic | Tony Cardenas (Incumbent) | 124,697 | 80.6 | |
| Republican | Benito Benny Bernal | 29,995 | 19.4 | |
| Total votes | 154,692 | 100.0 | ||
| Democratic hold | ||||
2020
| Party | Candidate | Votes | % | |
|---|---|---|---|---|
| Democratic | Tony Cárdenas (incumbent) | 119,420 | 56.6 | |
| Democratic | Angélica Dueñas | 91,524 | 43.4 | |
| Total votes | 210,944 | 100.0 | ||
| Democratic hold | ||||
Historical district boundaries
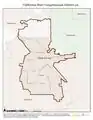 2013–present
From 2003 through 2013, the district consisted of parts of northern Los Angeles, including Burbank, Glendale and Pasadena. Due to redistricting after the 2010 United States Census, the district shifted north west within Los Angeles County and includes the northern San Fernando Valley.
References
- US Census
- LA Times
- "Partisan Voting Index – Districts of the 115th Congress" (PDF). The Cook Political Report. April 7, 2017. Retrieved April 7, 2017.
- Statement of Vote (1990 Governor)
- Statement of Vote (1992 President)
- Statement of Vote (1992 Senate)
- Statement of Vote (1992 Senate)
- Statement of Vote (1994 Governor)
- Statement of Vote (1994 Senate)
- Statement of Vote (1996 President)
- Statement of Vote (1998 Governor) Archived September 29, 2011, at the Wayback Machine
- Statement of Vote (1998 Senate) Archived September 29, 2011, at the Wayback Machine
- Statement of Vote (2000 President)
- Statement of Vote (2000 Senator)
- Statement of Vote (2002 Governor)
- Statement of Vote (2003 Recall Question)
- Statement of Vote (2003 Governor)
- Statement of Vote (2004 President)
- Statement of Vote (2004 Senator)
- Statement of Vote (2006 Governor)
- Statement of Vote (2006 Senator)
- Statement of Vote (2008 President)
- Statement of Vote (2010 Governor)
- Statement of Vote (2010 Senator)
- Statement of Vote (2012 President)
- Statement of Vote (2012 Senator)
- Statement of Vote (2014 Governor)
- Statement of Vote (2016 President)
- Statement of Vote (2016 Senator)
- Statement of Vote (2018 Governor)
- Statement of Vote (2018 Senator)
- https://www.dailykos.com/stories/2012/11/19/1163009/-Daily-Kos-Elections-presidential-results-by-congressional-district-for-the-2012-2008-elections
- 1952 election results
- 1954 election results
- 1956 election results
- 1958 election results
- 1960 election results
- 1962 election results
- 1964 election results
- 1966 election results
- 1968 election results
- 1970 election results
- 1972 election results
- 1974 election results
- 1976 election results
- 1978 election results
- 1980 election results
- 1982 election results
- 1984 election results
- 1986 election results
- 1988 election results
- 1990 election results
- 1992 election results
- 1994 election results
- 1996 election results
- 1998 election results
- 2000 election results
- 2002 election results
- 2004 election results
- 2006 election results
- 2008 election results
- 2010 election results
- 2012 election results
- 2014 election results
- 2016 election results
- 2018 election results