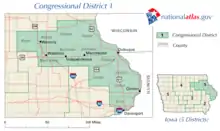
Iowa's 1st congressional district
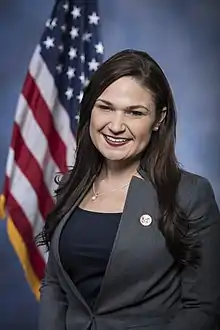
Iowa's 1st congressional district is a congressional district in the U.S. state of Iowa that covers its northeastern part. The district includes the cities of Dubuque, Cedar Rapids and Waterloo. Republican Ashley Hinson is the current U.S. representative.
| Iowa's 1st congressional district | |||
|---|---|---|---|
.tif.png.webp) Iowa's 1st congressional district since January 3, 2013 | |||
| Representative |
| ||
| Distribution |
| ||
| Population (2019) | 774,014 | ||
| Median household income | $61,542[1] | ||
| Ethnicity | |||
| Cook PVI | D+1[3] | ||
Redistricting
On June 22, 2001, the Iowa General Assembly passed a redistricting plan. The plan went into effect in 2002 for the 108th United States Congress. The prior redistricting plan was effective from 1992 to 2001.[4]
Cities in the district
Statewide races since 2000
Election results from statewide races:
| Office | Year | District | Statewide | Nationwide |
|---|---|---|---|---|
| President | 2000 | Al Gore 52% – George W. Bush 45% | Gore | Bush |
| 2004 | John Kerry 53% – George W. Bush 46% | Bush | ||
| 2008 | Barack Obama 58% – John McCain 41% | Obama | Obama | |
| 2012 | Barack Obama 56% – Mitt Romney 43% | |||
| 2016 | Donald Trump 49% – Hillary Clinton 45% | Trump | Trump | |
| 2020 | Donald Trump 50.8% – Joe Biden 47.4% | Biden | ||
| U.S. Senator | 2014 | Joni Ernst 48.3% – Bruce Braley 47.9% | Ernst | n/a |
| Governor | 2014 | Terry Branstad 56% – Jack Hatch 41% | Branstad | |
| 2018 | Fred Hubbell 49.3% – Kim Reynolds 48% | Reynolds |
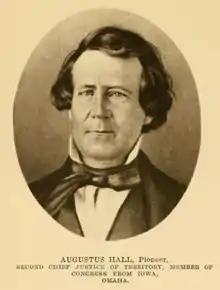
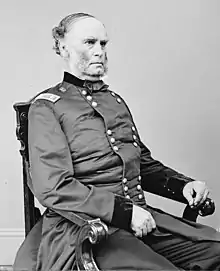
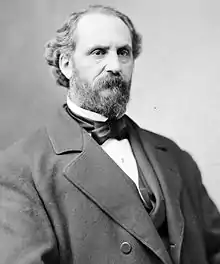
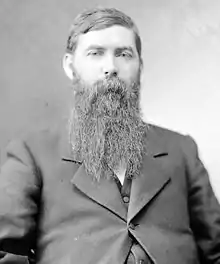
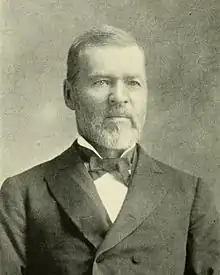
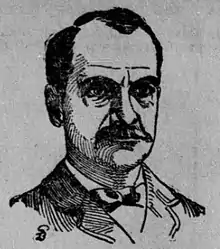
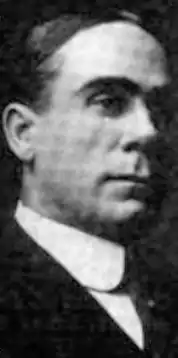
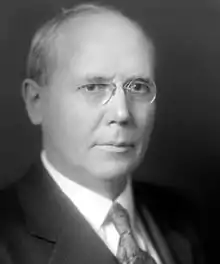
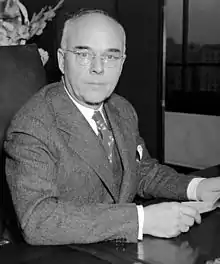
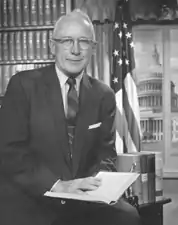
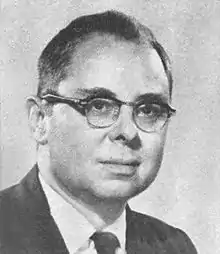
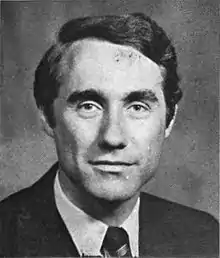
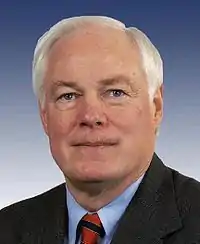
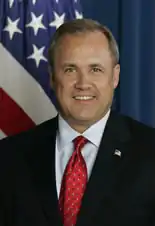
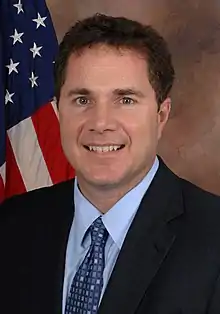
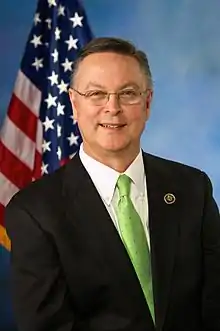
List of members representing the district

.jpg.webp)
.jpg.webp)


.jpg.webp)
.jpg.webp)
.jpg.webp)


Recent election results
| Year[6] | Winner | Loser | Percentage of votes | ||||
|---|---|---|---|---|---|---|---|
| Party | Candidate | Votes | Party | Candidate | Votes | ||
| 1920 | Republican | William F. Kopp | 38,100 | Democratic | E. W. McManus | 20,977 | 64–36% |
| 1922 | 26,651 | John M. Lindley | 14,056 | 65–34% | |||
| 1924 | 42,711 | James M. Bell | 17,110 | 71–29% | |||
| 1926 | 27,358 | 11,408 | 71–29% | ||||
| 1928 | 45,806 | unopposed | 100–0% | ||||
| 1930 | 27,053 | Democratic | Max A. Conrad | 15,538 | 63–36% | ||
| 1932 | Democratic | Edward C. Eicher | 55,378 | Republican | William F. Kopp | 46,738 | 54–46% |
| 1934 | 48,544 | E. R. Hicklin | 39,047 | 55–44% | |||
| 1936 | 55,721 | John N. Calhoun | 53,474 | 51–49% | |||
| 1938 | Republican | Thomas E. Martin | 46,636 | Democratic | James P. Gaffney | 33,765 | 58–42% |
| 1940 | 70,120 | Zoe S. Nabers | 46,040 | 60–40% | |||
| 1942 | 55,139 | Vern W. Nall | 32,893 | 61–37% | |||
| 1944 | 72,729 | Clair A. Williams | 60,048 | 55–45% | |||
| 1946 | 52,488 | 32,849 | 62–38% | ||||
| 1948 | 70,959 | James D. France | 60,860 | 53–46% | |||
| 1950 | 70,058 | 43,140 | 62–38% | ||||
| 1952 | 105,526 | Clair A. Williams | 62,011 | 63–37% | |||
| 1954 | Fred Schwengel | 67,128 | John O'Connor | 50,577 | 57–43% | ||
| 1956 | 94,223 | Ronald O. Bramhall | 68,287 | 58–42% | |||
| 1958 | 59,577 | Thomas J. Dailey | 51,996 | 53–47% | |||
| 1960 | 104,737 | Walter J. Guenther | 67,287 | 61–39% | |||
| 1962 | 65,975 | Harold Stephens | 42,000 | 61–39% | |||
| 1964 | Democratic | John R. Schmidhauser | 84,042 | Republican | Fred Schwengel | 80,697 | 51–49% |
| 1966 | Republican | Fred Schwengel | 64,795 | Democratic | John R. Schmidhauser | 60,534 | 51–48% |
| 1968 | 91,419 | 81,049 | 53–47% | ||||
| 1970 | 60,270 | Edward Mezvinsky | 59,505 | 50–49% | |||
| 1972 | Democratic | Edward Mezvinsky | 107,099 | Republican | Fred Schwengel | 91,609 | 53–46% |
| 1974 | 75,687 | Jim Leach | 63,540 | 54–46% | |||
| 1976 | Republican | Jim Leach | 109,694 | Democratic | Edward Mezvinsky | 101,024 | 52–48% |
| 1978 | 79,940 | Richard E. Meyers | 45,037 | 63–36% | |||
| 1980 | 133,349 | Jim Larew | 72,602 | 64–35% | |||
| 1982 | 89,595 | Bill Gluba | 61,734 | 59–41% | |||
| 1984 | 131,182 | Kevin Ready | 65,293 | 68–33% | |||
| 1986 | 86,834 | John Whitaker | 43,985 | 66–34% | |||
| 1988 | 112,746 | Bill Gluba | 71,280 | 61–38% | |||
| 1990 | 90,042 | scattering | 151 | 99–1% | |||
| 1992 | 178,042 | Democratic | Jan J. Zonneveld | 81,600 | 68–31% | ||
| 1994 | 110,448 | Glen Winekauf | 69,461 | 60–38% | |||
| 1996 | 129,242 | Bob Rush | 111,595 | 53–46% | |||
| 1998 | 106,419 | 79,529 | 57–42% | ||||
| 2000 | 164,972 | Bob Simpson | 96,283 | 62–36% | |||
| 2002 | Jim Nussle | 112,280 | Ann Hutchinson | 83,779 | 57–43% | ||
| 2004 | 159,993 | Bill Gluba | 125,490 | 55–44% | |||
| 2006 | Democratic | Bruce Braley | 113,724 | Republican | Mike Whalen | 89,471 | 56–44% |
| 2008 | 178,229 | David Hartsuch | 99,447 | 64–35% | |||
| 2010 | 103,931[7] | Ben Lange | 99,976 | 49–48% | |||
| 2012 | 222,422 | 162,465 | 57–42% | ||||
| 2014 | Republican | Rod Blum | 147,513 | Democratic | Pat Murphy | 140,086 | 51–49% |
| 2016 | 206,903 | Monica Vernon | 177,403 | 53.7–46.1% | |||
| 2018 | Democratic | Abby Finkenauer | 169,348 | Republican | Rod Blum | 152,540 | 50.9–46.0% |
| 2020 | Republican | Ashley Hinson | 211,679 | Democratic | Abby Finkenauer | 200,893 | 51.3–48.7% |
2002
| Party | Candidate | Votes | % | |
|---|---|---|---|---|
| Republican | Jim Nussle | 112,280 | 57.15 | |
| Democratic | Ann Hutchinson | 83,779 | 42.65 | |
| No party | Others | 396 | 0.20 | |
| Total votes | 196,455 | 100.00 | ||
| Turnout | ||||
| Republican hold | ||||
2004
| Party | Candidate | Votes | % | |
|---|---|---|---|---|
| Republican | Jim Nussle* | 159,993 | 55.16 | |
| Democratic | Bill Gluba | 125,490 | 43.26 | |
| Libertarian | Mark Nelson | 2,727 | 0.94 | |
| Independent | Denny Heath | 1,756 | 0.61 | |
| No party | Others | 88 | 0.03 | |
| Total votes | 290,054 | 100.00 | ||
| Turnout | ||||
| Republican hold | ||||
2006
| Party | Candidate | Votes | % | |||
|---|---|---|---|---|---|---|
| Democratic | Bruce Braley | 114,322 | 55.06 | |||
| Republican | Mike Whalen | 89,729 | 43.22 | |||
| Independent | James Hill | 2,201 | 1.06 | |||
| Libertarian | Albert W. Schoeman | 1,226 | 0.59 | |||
| No party | Others | 143 | 0.07 | |||
| Total votes | 207,621 | 100.00 | ||||
| Turnout | ||||||
| Democratic gain from Republican | ||||||
- Note: James Hill ran on the Pirate Party platform on the ballot.
2008
| Party | Candidate | Votes | % | |
|---|---|---|---|---|
| Democratic | Bruce Braley* | 186,991 | 64.56 | |
| Republican | David Hartsuch | 102,439 | 35.37 | |
| No party | Others | 199 | 0.07 | |
| Total votes | 289,629 | 100.00 | ||
| Turnout | ||||
| Democratic hold | ||||
2010
| Party | Candidate | Votes | % | |
|---|---|---|---|---|
| Democratic | Bruce Braley* | 104,428 | 49.52 | |
| Republican | Ben Lange | 100,219 | 47.52 | |
| Libertarian | Rob Petsche | 4,087 | 1.94 | |
| Independent | Jason A. Faulkner | 2,092 | 0.99 | |
| No party | Others | 76 | 0.04 | |
| Total votes | 210,902 | 100.00 | ||
| Turnout | ||||
| Democratic hold | ||||
2012
| Party | Candidate | Votes | % | |
|---|---|---|---|---|
| Democratic | Bruce Braley* | 222,422 | 54.90 | |
| Republican | Ben Lange | 162,465 | 40.10 | |
| Independent | Gregory Hughes | 4,772 | 1.18 | |
| Independent | George Todd Krail II | 931 | 0.23 | |
| No party | Others | 259 | 0.06 | |
| Total votes | 405,110 | 100.00 | ||
| Turnout | ||||
| Democratic hold | ||||
2014
| Party | Candidate | Votes | % | |||
|---|---|---|---|---|---|---|
| Republican | Rod Blum | 145,383 | 51.18 | |||
| Democratic | Pat Murphy | 138,335 | 48.70 | |||
| No party | Others | 348 | 0.12 | |||
| Total votes | 284,066 | 100.00 | ||||
| Republican gain from Democratic | ||||||
2016
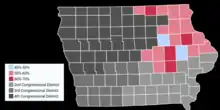
Map showing the results of the 2016 election in Iowa's 1st congressional district by county
| Party | Candidate | Votes | % | |
|---|---|---|---|---|
| Republican | Rod Blum (incumbent) | 206,903 | 53.7 | |
| Democratic | Monica Vernon | 177,403 | 46.1 | |
| No party | Others | 671 | 0.2 | |
| Total votes | 384,977 | 100.00 | ||
| Republican hold | ||||
2018
| Party | Candidate | Votes | % | ±% | |
|---|---|---|---|---|---|
| Democratic | Abby Finkenauer | 169,496 | 50.9 | +4.8 | |
| Republican | Rod Blum (incumbent) | 153,077 | 45.6 | −7.7 | |
| Libertarian | Troy Hageman | 10,239 | 3.1 | +3.1 | |
| Write-ins | 171 | 0.05 | −0.15 | ||
| Majority | 16,419 | 5.3 | |||
| Turnout | 332,983 | 100 | |||
| Democratic gain from Republican | Swing | +12.5 | |||
2020
| Party | Candidate | Votes | % | ±% | |
|---|---|---|---|---|---|
| Republican | Ashley Hinson | 211,679 | 51.3 | ||
| Democratic | Abby Finkenauer (incumbent) | 200,893 | 48.7 | ||
| Majority | |||||
| Republican gain from Democratic | Swing | ||||
Historical district boundaries
References
- Center for New Media & Promotion (CNMP), US Census Bureau. "My Congressional District". www.census.gov.
- "Census profile: Congressional District 1, IA". Census Reporter.
- "Partisan Voting Index – Districts of the 115th Congress" (PDF). The Cook Political Report. April 7, 2017. Retrieved April 7, 2017.
- "2001 Iowa Redistricting Plan". Iowa General Assembly. 2001. Archived from the original on October 16, 2006. Retrieved November 10, 2006.
- Schmidt, Louis B., "The Miller-Thompson Election Contest," Iowa Journal of History and Politics 12, pp. 34-127 (Jan. 1914).
- "Election Statistics". 2005. Archived from the original on July 25, 2007.
- "Election 2020 – Live Election Results:Iowa". CBS News.
- "Iowa General Election 2018". Iowa Secretary of State. Retrieved November 11, 2018.
- Martis, Kenneth C. (1989). The Historical Atlas of Political Parties in the United States Congress. New York: Macmillan Publishing Company.
- Martis, Kenneth C. (1982). The Historical Atlas of United States Congressional Districts. New York: Macmillan Publishing Company.
- Congressional Biographical Directory of the United States 1774–present
This article is issued from Wikipedia. The text is licensed under Creative Commons - Attribution - Sharealike. Additional terms may apply for the media files.