Iowa's 2nd congressional district
Iowa's 2nd congressional district is a congressional district in the U.S. state of Iowa that covers most of its southeastern part. It includes Davenport, Iowa City, Muscatine, Clinton, Burlington, Ottumwa, Fort Madison, Oskaloosa, Bettendorf, Newton and Pella. The bulk of its vote is cast in Iowa City and the Iowa side of the Quad Cities.
| Iowa's 2nd congressional district | |||
|---|---|---|---|
.tif.png.webp) Iowa's 2nd congressional district since January 3, 2013 | |||
| Representative |
| ||
| Distribution |
| ||
| Population (2019) | 782,989 | ||
| Median household income | $59,569[1] | ||
| Ethnicity | |||
| Cook PVI | D+1[3] | ||
The district is represented by Republican Mariannette Miller-Meeks.
Statewide races since 2000
Election results from statewide races:
| Office | Year | District | Statewide | Nationwide |
|---|---|---|---|---|
| President | 2000 | Al Gore 53% – George W. Bush 43% | Gore | Bush |
| 2004 | John Kerry 55% – George W. Bush 44% | Bush | ||
| 2008 | Barack Obama 60% – John McCain 38% | Obama | Obama | |
| 2012 | Barack Obama 56% – Mitt Romney 43% | |||
| 2016 | Donald Trump 49% – Hillary Clinton 44% | Trump | Trump | |
| 2020 | Donald Trump 51% – Joe Biden 47% | Biden | ||
| U.S. Senator | 2014 | Joni Ernst 49% – Bruce Braley 47% | Ernst | n/a |
| Governor | 2014 | Terry Branstad 57% – Jack Hatch 40% | Branstad | |
| 2018 | Fred Hubbell 50.72% – Kim Reynolds 47.29% | Reynolds |
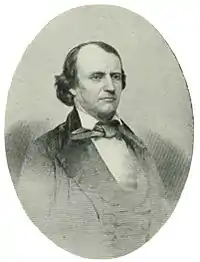
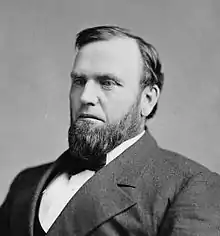
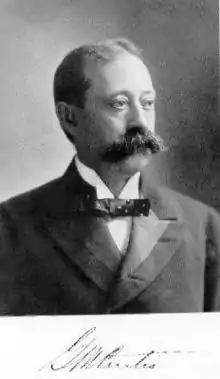
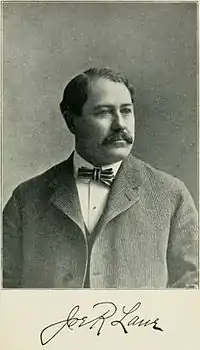
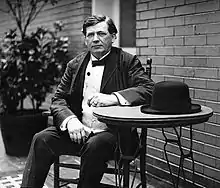
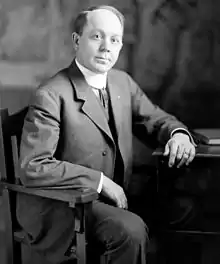
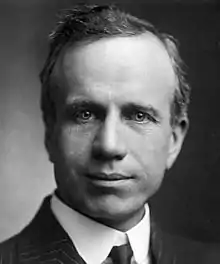
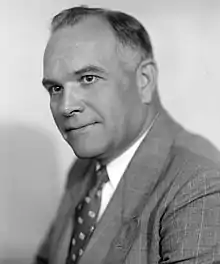
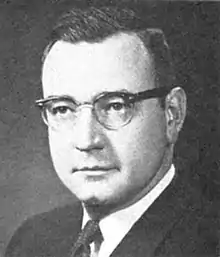
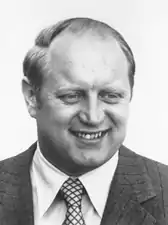
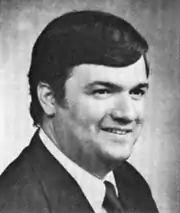
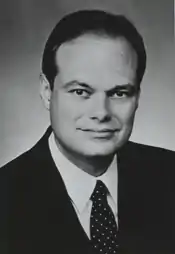
List of members representing the district
.jpg.webp)
.jpg.webp)
_2.jpg.webp)
.jpg.webp)


.jpg.webp)

_2.jpg.webp)
.jpg.webp)

.jpg.webp)
.jpg.webp)
.jpg.webp)
.jpg.webp)
.jpg.webp)
.jpg.webp)
.jpg.webp)


- Service effectively ended in 1861 when promoted to Major General, but did not officially resign.
- Although his official Congressional biography states he declined to run for a third term, newspaper reports indicate that he was an active but unsuccessful candidate for renomination
Recent election results
| Year | Winner | Second | Percentage | ||||
|---|---|---|---|---|---|---|---|
| Party affiliation | Candidate | Votes | Party affiliation | Candidate | Votes | ||
| 1920 | Republican | Harry E. Hull | 50,160 | Farmer–Labor | F. B. Althouse | 6,058 | 89% – 11% |
| 1922 | 27,450 | Democratic | Wayne G. Cook | 25,620 | 51% – 48% | ||
| 1924 | Fred Dickinson Letts | 49,117 | Ralph U. Thompson | 32,893 | 60% – 40% | ||
| 1926 | 29,200 | J. P. Gallagher | 19,612 | 60% – 40% | |||
| 1928 | 49,690 | Frank Z. Titzell | 37,344 | 57% – 43% | |||
| 1930 | Democratic | Bernhard M. Jacobsen | 30,008 | Republican | F. D. Letts | 24,113 | 55% – 45% |
| 1932 | 71,914 | Frank W. Elliott | 50,636 | 59% – 41% | |||
| 1934 | 60,654 | Martin B. Andelfinger | 39,047 | 63% – 35% | |||
| 1936 | William S. Jacobsen | 70,923 | Charles Penningroth | 55,255 | 53% – 41% | ||
| 1938 | 48,155 | Alfred C. Mueller | 47,535 | 50% – 49% | |||
| 1940 | 75,774 | W. A. McCullough | 69,298 | 52% – 48% | |||
| 1942 | Republican | Henry O. Talle | 62,290 | Democratic | William S. Jacobsen | 46,310 | 57% – 43% |
| 1944 | 86,903 | George C. Classen | 68,489 | 56% – 44% | |||
| 1946 | 60,111 | Richard V. Bernhart | 41,544 | 59% – 41% | |||
| 1948 | 82,139 | T. W. Mullaney | 60,272 | 57% – 42% | |||
| 1950 | 79,066 | Eugene J. Kean | 55,359 | 59% – 41% | |||
| 1952 | 114,553 | T. W. Mullaney | 69,421 | 62% – 38% | |||
| 1954 | 72,231 | Ruben V. Austin | 58,092 | 55% – 46% | |||
| 1956 | 95,999 | Leonard G. Wolf | 90,843 | 51% – 49% | |||
| 1958 | Democratic | Leonard G. Wolf | 67,022 | Republican | Henry O. Talle | 64,073 | 51% – 49% |
| 1960 | Republican | James E. Bromwell | 108,137 | Democratic | Leonard G. Wolf | 97,608 | 53% – 47% |
| 1962 | 67,475 | Frank W. Less | 60,296 | 53% – 47% | |||
| 1964 | Democratic | John C. Culver | 97,470 | Republican | James E. Bromwell | 89,299 | 52% – 48% |
| 1966 | 76,281 | Robert M. L. Johnson | 65,079 | 54% – 46% | |||
| 1968 | 103,651 | Tom Riley | 84,634 | 55% – 45% | |||
| 1970 | 84,049 | Cole McMartin | 54,934 | 60% – 40% | |||
| 1972 | 115,489 | Theodore R. Ellsworth | 79,667 | 59% – 41% | |||
| 1974 | Michael T. Blouin | 73,416 | Tom Riley | 69,088 | 51% – 48% | ||
| 1976 | 102,980 | 100,344 | 50% – 49% | ||||
| 1978 | Republican | Thomas J. Tauke | 72,644 | Democratic | Michael T. Blouin | 65,450 | 52% – 47% |
| 1980 | 111,587 | Steve Sovern | 93,175 | 54% – 45% | |||
| 1982 | 99,478 | Brent Appel | 69,539 | 59% – 41% | |||
| 1984 | 136,839 | Joe Welsh | 77,335 | 64% – 36% | |||
| 1986 | 88,708 | Eric Tabor | 55,903 | 61% – 39% | |||
| 1988 | 113,543 | 86,438 | 58% – 43% | ||||
| 1990 | Jim Nussle | 82,650 | 81,008 | 50% – 49% | |||
| 1992 | 134,536 | David R. Nagle | 131,570 | 50% – 49% | |||
| 1994 | 111,076 | 86,087 | 56% – 43% | ||||
| 1996 | 127,827 | Donna L. Smith | 109,731 | 53% – 46% | |||
| 1998 | 104,613 | Rob Tully | 83,405 | 55% – 44% | |||
| 2000 | 139,906 | Donna L. Smith | 110,327 | 55% – 44% | |||
| 2002 | Jim Leach | 108,130 | Julie Thomas | 94,767 | 52% – 46% | ||
| 2004 | 176,684 | Dave Franker | 117,405 | 59% – 39% | |||
| 2006 | Democratic | Dave Loebsack | 107,097 | Republican | Jim Leach | 101,386 | 51% – 49% |
| 2008 | 173,639 | Mariannette Miller-Meeks | 118,040 | 57% – 38% | |||
| 2010 | 115,839 | 104,319 | 50% – 45% | ||||
| 2012 | 211,863 | John Archer | 161,977 | 55% – 42% | |||
| 2014 | 143,431 | Mariannette Miller-Meeks | 129,455 | 52% – 47% | |||
| 2016 | 198,571 | Christopher Peters | 170,933 | 53% – 46% | |||
| 2018 | 171,120 | 133,051 | 54% – 42% | ||||
| 2020 | Republican | Mariannette Miller-Meeks | 196,864 | Democratic | Rita Hart | 196,858 | 49.910% – 49.908% |
- "Election Statistics". 2005. Archived from the original on July 25, 2007.
2002
| Party | Candidate | Votes | % | |
|---|---|---|---|---|
| Republican | Jim Leach | 108,130 | 52.19% | |
| Democratic | Julie Thomas | 94,767 | 45.74% | |
| Libertarian | Kevin Litten | 4,178 | 2.02% | |
| No party | Others | 96 | 0.05% | |
| Total votes | 207,171 | 100.00% | ||
| Republican hold | ||||
2004
| Party | Candidate | Votes | % | |
|---|---|---|---|---|
| Republican | Jim Leach (incumbent) | 176,684 | 58.92% | |
| Democratic | Dave Franker | 117,405 | 39.15% | |
| Libertarian | Kevin Litten | 5,586 | 1.86% | |
| No party | Others | 206 | 0.07% | |
| Total votes | 299,881 | 100.00% | ||
| Republican hold | ||||
2006
| Party | Candidate | Votes | % | |||
|---|---|---|---|---|---|---|
| Democratic | Dave Loebsack | 107,683 | 51.38% | |||
| Republican | Jim Leach (incumbent) | 101,707 | 48.53% | |||
| No party | Others | 196 | 0.09% | |||
| Total votes | 209,586 | 100.00% | ||||
| Democratic gain from Republican | ||||||
2008
| Party | Candidate | Votes | % | |
|---|---|---|---|---|
| Democratic | Dave Loebsack (incumbent) | 175,218 | 57.19% | |
| Republican | Mariannette Miller-Meeks | 118,778 | 38.77% | |
| Green | Wendy Barth | 6,664 | 2.18% | |
| Independent | Brian White | 5,437 | 1.78% | |
| No party | Others | 261 | 0.09% | |
| Total votes | 306,358 | 100.00% | ||
| Democratic hold | ||||
2010
| Party | Candidate | Votes | % | |
|---|---|---|---|---|
| Democratic | Dave Loebsack (incumbent) | 115,839 | 50.99% | |
| Republican | Mariannette Miller-Meeks | 104,319 | 45.92% | |
| Libertarian | Gary Joseph Sicard | 4,356 | 1.92% | |
| Constitution | Jon Tack | 2,463 | 1.08% | |
| No party | Others | 198 | 0.09% | |
| Total votes | 227,175 | 100.00% | ||
| Democratic hold | ||||
2012
| Party | Candidate | Votes | % | |
|---|---|---|---|---|
| Democratic | Dave Loebsack (incumbent) | 211,863 | 55.57% | |
| Republican | John Archer | 161,977 | 42.48% | |
| Independent | Alan Aversa | 7,112 | 1.87% | |
| No party | Others | 323 | 0.08% | |
| Total votes | 381,275 | 100.00% | ||
| Democratic hold | ||||
2014
| Party | Candidate | Votes | % | |
|---|---|---|---|---|
| Democratic | Dave Loebsack (incumbent) | 143,431 | 52.5% | |
| Republican | Mariannette Miller-Meeks | 129,455 | 47.4% | |
| Write-ins | 443 | 0.2% | ||
| Total votes | 273,329 | 100% | ||
| Democratic hold | ||||
2016
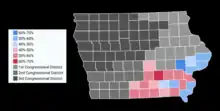
Map showing the results of the 2016 election in Iowa's second congressional district by county
| Party | Candidate | Votes | % | |
|---|---|---|---|---|
| Democratic | Dave Loebsack (incumbent) | 198,571 | 53.7% | |
| Republican | Christopher Peters | 170,933 | 46.2% | |
| Write-ins | 528 | 0.1% | ||
| Total votes | 370,032 | 100.00% | ||
| Democratic hold | ||||
2018
| Party | Candidate | Votes | % | ±% | |
|---|---|---|---|---|---|
| Democratic | Dave Loebsack (incumbent) | 171,120 | 54.8% | +1.1 | |
| Republican | Christopher Peters | 133,051 | 42.6% | −3.6 | |
| Libertarian | Mark David Strauss | 6,176 | 1.98% | +1.98 | |
| Independent | Daniel Clark | 1,839 | 0.59% | +0.59 | |
| Write-ins | 171 | 0.05% | −0.05 | ||
| Majority | 38,069 | 12.2% | |||
| Turnout | 312,357 | 100% | |||
| Democratic hold | Swing | +4.7 | |||
2020
| Party | Candidate | Votes | % | |
|---|---|---|---|---|
| Republican | Mariannette Miller-Meeks | 196,864 | 49.910 | |
| Democratic | Rita Hart | 196,858 | 49.908 | |
| Total votes | 394,439 | 100.0 | ||
| Republican gain from Democratic | ||||
Historical district boundaries

Iowa's 2nd congressional district boundaries from 2003 to 2013
References
- Center for New Media & Promotion (CNMP), US Census Bureau. "My Congressional District". www.census.gov.
- "Census profile: Congressional District 2, IA". Census Reporter.
- "Partisan Voting Index – Districts of the 115th Congress" (PDF). The Cook Political Report. April 7, 2017. Retrieved April 7, 2017.
- "Iowa General Election 2018". Iowa Secretary of State. Retrieved November 11, 2018.
- Martis, Kenneth C. (1989). The Historical Atlas of Political Parties in the United States Congress. New York: Macmillan Publishing Company.
- Martis, Kenneth C. (1982). The Historical Atlas of United States Congressional Districts. New York: Macmillan Publishing Company.
- Congressional Biographical Directory of the United States 1774–present
This article is issued from Wikipedia. The text is licensed under Creative Commons - Attribution - Sharealike. Additional terms may apply for the media files.