Lincolnshire County Council elections
Lincolnshire County Council in England is elected every four years.
Political control
Since 1973 political control of the council has been held by the following parties:[1]
| Party in control | Years |
|---|---|
| No overall control | 1973 - 1977 |
| Conservative | 1977 - 1993 |
| No overall control | 1993 - 1997 |
| Conservative | 1997 - 2013 |
| No overall control | 2013 - 2017 |
| Conservative | 2017–present |
Council elections
- 1973 Lincolnshire County Council election
- 1977 Lincolnshire County Council election
- 1981 Lincolnshire County Council election (boundary changes)
- 1985 Lincolnshire County Council election
- 1989 Lincolnshire County Council election
- 1993 Lincolnshire County Council election
- 1997 Lincolnshire County Council election
- 2001 Lincolnshire County Council election (boundary changes increased the number of seats by 1)[2]
- 2005 Lincolnshire County Council election
- 2009 Lincolnshire County Council election
- 2013 Lincolnshire County Council election
- 2017 Lincolnshire County Council election
County result maps
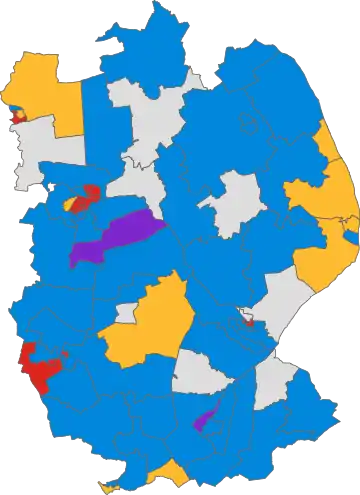 1981 results map
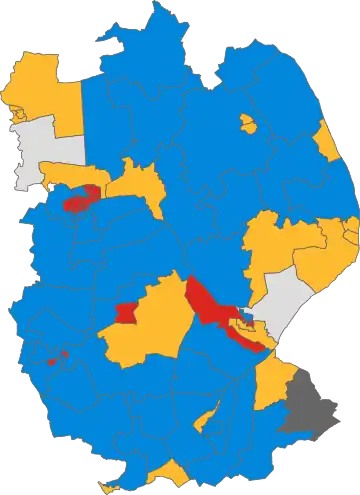 1985 results map
 1989 results map
 1993 results map
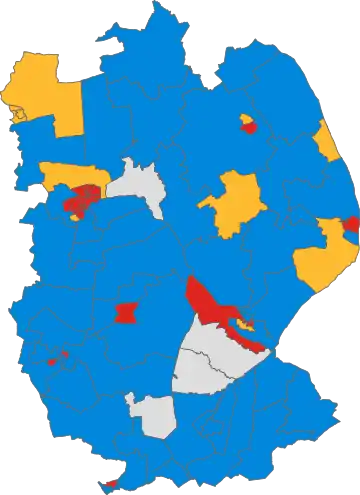 1997 results map
 2001 results map
 2005 results map
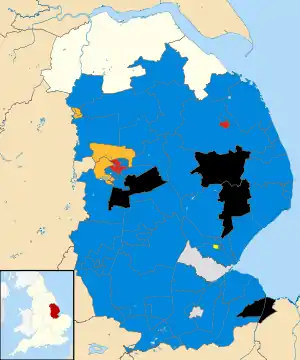 2009 results map
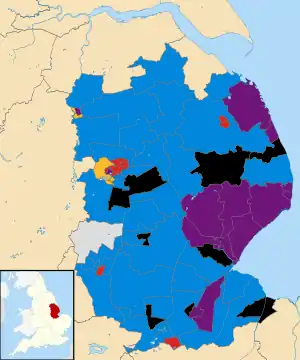 2013 results map
By-election results
1997-2001
| Party | Candidate | Votes | % | ±% | |
|---|---|---|---|---|---|
| Conservative | 449 | 46.8 | -19.2 | ||
| Liberal Democrats | 354 | 36.9 | +36.9 | ||
| Labour | 156 | 16.3 | -17.7 | ||
| Majority | 95 | 9.9 | |||
| Turnout | 959 | 13.0 | |||
| Conservative hold | Swing | ||||
| Party | Candidate | Votes | % | ±% | |
|---|---|---|---|---|---|
| Liberal Democrats | 296 | 46.9 | +11.5 | ||
| Conservative | 212 | 33.6 | +7.0 | ||
| Labour | 105 | 16.6 | -18.5 | ||
| Independent | 18 | 2.9 | +2.9 | ||
| Majority | 84 | 13.3 | |||
| Turnout | 631 | 13.5 | |||
| Liberal Democrats hold | Swing | ||||
2001-2005
| Party | Candidate | Votes | % | ±% | |
|---|---|---|---|---|---|
| Labour | 524 | 45.9 | -17.4 | ||
| Independent | 339 | 29.7 | +17.3 | ||
| Conservative | 235 | 20.6 | +0.0 | ||
| Green | 44 | 3.9 | +3.9 | ||
| Majority | 185 | 16.2 | |||
| Turnout | 1,142 | 20.6 | |||
| Labour hold | Swing | ||||
2005-2009
| Party | Candidate | Votes | % | ±% | |
|---|---|---|---|---|---|
| Conservative | Peter Bedford | 800 | 57.9 | +10.3 | |
| UKIP | Sue Ransome | 217 | 15.7 | -8.8 | |
| Labour | Paul Kenny | 205 | 14.8 | -13.2 | |
| Liberal Democrats | Albert Tebbs | 160 | 11.6 | +11.6 | |
| Majority | 583 | 42.2 | |||
| Turnout | 1,382 | 25.0 | |||
| Conservative hold | Swing | ||||
| Party | Candidate | Votes | % | ±% | |
|---|---|---|---|---|---|
| Conservative | Charlotte Farquharson | 657 | 44.6 | -2.5 | |
| Labour | Trevor Holmes | 435 | 29.5 | +2.6 | |
| Liberal Democrats | Timothy Fitzgerald | 255 | 17.3 | -8.7 | |
| UKIP | Jamie Corney | 127 | 8.6 | +8.6 | |
| Majority | 222 | 15.1 | |||
| Turnout | 1,474 | 23.5 | |||
| Conservative hold | Swing | ||||
| Party | Candidate | Votes | % | ±% | |
|---|---|---|---|---|---|
| Conservative | Clive Oxby | 877 | 61.8 | +14.5 | |
| Labour | Darren Hopewell | 206 | 14.5 | -26.9 | |
| Liberal Democrats | Roy Harris | 137 | 9.7 | +9.7 | |
| BNP | Michael Clayton | 126 | 8.9 | +8.9 | |
| UKIP | Steven Pearson | 52 | 3.7 | -7.6 | |
| Independent | Victor Sahunta | 21 | 1.5 | +1.5 | |
| Majority | 671 | 47.3 | |||
| Turnout | 1,419 | 26.2 | |||
| Conservative hold | Swing | ||||
| Party | Candidate | Votes | % | ±% | |
|---|---|---|---|---|---|
| Conservative | Hugo Marfleet | 1,013 | 49.9 | +13.5 | |
| Independent | Daniel Simpson | 361 | 17.8 | -0.6 | |
| Liberal Democrats | Eric Needham | 304 | 15.0 | -18.4 | |
| BNP | Robert West | 219 | 10.8 | +10.8 | |
| Labour | Michael Preen | 75 | 3.7 | +3.7 | |
| UKIP | Barry Gleeson | 59 | 2.9 | -9.0 | |
| Majority | 652 | 32.1 | |||
| Turnout | 2,031 | 31.9 | |||
| Conservative hold | Swing | ||||
| Party | Candidate | Votes | % | ±% | |
|---|---|---|---|---|---|
| Conservative | Sue Woolley | 760 | 41.4 | -12.9 | |
| Independent | Helen Powell | 355 | 19.3 | +19.3 | |
| BNP | David Owens | 239 | 13.0 | +13.0 | |
| Labour | Roberta Britton | 202 | 11.0 | -34.7 | |
| Liberal Democrats | Peter Morris | 198 | 10.8 | +10.8 | |
| Green | Ashley Baxter | 42 | 2.3 | +2.3 | |
| UKIP | Peter Oldham | 41 | 2.2 | +2.2 | |
| Majority | 405 | 22.1 | |||
| Turnout | 1,837 | 21.0 | |||
| Conservative hold | Swing | ||||
2009-2013
| Party | Candidate | Votes | % | ±% | |
|---|---|---|---|---|---|
| Conservative | Andrea Jenkyns | 597 | 38.7 | +13.2 | |
| BNP | David Owens | 581 | 37.7 | +17.1 | |
| Labour | Pam Kenny | 204 | 13.2 | +1.9 | |
| Liberal Democrats | Michael Shriden-Shinn | 160 | 10.4 | +3.2 | |
| Majority | 16 | 1.0 | |||
| Turnout | 1,542 | 21.3 | |||
| Conservative hold | Swing | ||||
References
- "Lincolnshire". BBC News Online. BBC. 5 June 2009. Retrieved 2009-06-11.
- "Lincolnshire". BBC News Online. BBC. Retrieved 2009-09-03.
- "Boston Coastal electoral division". Boston borough council. Archived from the original on 2011-06-03. Retrieved 2009-09-03.
- "Declaration of result of poll" (PDF). South Kesteven District Council. Retrieved 2009-09-03.
- "Declaration of result of poll" (PDF). Lincolnshire County Council. Retrieved 2009-09-03.
- "Tories win by-election but BNP beat Labour". Louth Leader. 2008-08-01. Retrieved 2009-09-03.
- "Conservatives win county seat in Bourne by-election". Spaldingtoday. 2008-10-03. Archived from the original on 2008-10-04. Retrieved 2009-09-03.
- "BNP narrowly beaten in by-election". Boston Standard. 2009-10-16. Retrieved 2009-10-17.
External links
| Lincolnshire County Council | |||||||||||||||||||||
|---|---|---|---|---|---|---|---|---|---|---|---|---|---|---|---|---|---|---|---|---|---|
| Boston Borough Council | |||||||||||||||||||||
| East Lindsey District Council |
| ||||||||||||||||||||
| City of Lincoln Council | |||||||||||||||||||||
| North East Lincolnshire Council | |||||||||||||||||||||
| North Kesteven District Council | |||||||||||||||||||||
| North Lincolnshire Council | |||||||||||||||||||||
| South Holland District Council |
| ||||||||||||||||||||
| South Kesteven District Council | |||||||||||||||||||||
| West Lindsey District Council | |||||||||||||||||||||
| |||||||||||||||||||||
| |||||||||||||||||||||
This article is issued from Wikipedia. The text is licensed under Creative Commons - Attribution - Sharealike. Additional terms may apply for the media files.