List of Canadian provinces and territories by life expectancy
This is a list of Canadian provinces and territories by life expectancy. Life expectancy is the average number of years of age that a group of infants born in the same year can expect to live, if maintained, from birth. The source is from the 2018 Canadian Vital Statistics Death Database [1]
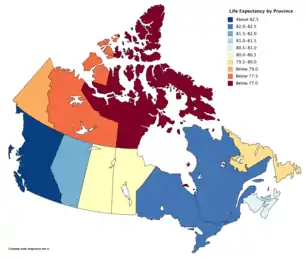
Life Expectancy in Canada in 2017
Life expectancy has increased in most Canadian provinces and territories due to medical advances in treating diseases such as heart disease and cancer - leading causes of death elsewhere worldwide. There were high gains in life expectancy in Nunavut due to improved rural health care; however, there were notable decreases in life expectancy in Newfoundland and Labrador.
Life expectancy in 2019
| Rank | Province/Territory | Life Expectancy[1] | Life Expectancy in 2010[2] | Change 2010-2019 | Male Life Expectancy[3] | Female Life Expectancy[3] | Comparable Country[4] |
|---|---|---|---|---|---|---|---|
| 1. | 82.9 | 81.4 | 81.1 | 84.5 | |||
| 2. | 82.4 | 81.7 | 80.3 | 84.5 | |||
| 3. | 82.4 | 82.1 | 80.0 | 84.8 | |||
| - | 82.1 | 81.2 | 80.0 | 84.2 | |||
| 4. | 81.6 | 81.3 | 79.6 | 83.6 | |||
| 4. | 81.6 | 81.2 | 79.4 | 84.0 | |||
| 6. | 80.7 | 80.7 | 78.6 | 82.8 | |||
| 7. | 80.4 | 80.3 | 78.3 | 82.4 | |||
| 8. | 80.3 | 79.6 | 78.0 | 82.7 | |||
| 9. | 80.1 | 79.9 | 77.9 | 82.3 | |||
| 10. | 80.0 | 79.6 | 78.0 | 82.0 | |||
| 11. | 79.0 | 77.3 | 76.2 | 81.7 | |||
| 12. | 77.4 | 77.8 | 75.6 | 79.1 | |||
| 13. | 71.1 | 70.4 | 69.3 | 72.8 |
.png.webp)
Life Expectancy in Canada 1921-2018 [5]
Past Life Expectancy
| Province/Territory | 2019[2] | 2010[2] | 2000[2] | 1990[2] | 1980[2] | Change 1980-2019 |
|---|---|---|---|---|---|---|
| 82.1 | 81.2 | 79.0 | 77.6 | 75.5 | ||
| 81.6 | 81.3 | 79.4 | 77.8 | 75.0 | ||
| 82.4 | 82.1 | 80.3 | 78.1 | 76.0 | ||
| 80.1 | 79.9 | 78.0 | 77.4 | 75.3 | ||
| 80.7 | 80.7 | 78.9 | 77.3 | 74.5 | ||
| 80.0 | 79.6 | 77.3 | 76.1 | 74.8 | ||
| 77.4 | 77.8 | 75.5 | 72.4 | 68.7 | ||
| 80.4 | 80.3 | 78.5 | 76.7 | 74.6 | ||
| 71.1 | 70.4 | 67.5 | 65.5 | 62.4 | ||
| 82.4 | 81.7 | 79.4 | 77.8 | 75.4 | ||
| 81.6 | 81.3 | 78.4 | 76.9 | 76.2 | ||
| 82.9 | 81.4 | 79.0 | 77.0 | 74.4 | ||
| 80.3 | 79.6 | 78.5 | 77.9 | 75.9 | ||
| 79.0 | 77.3 | 75.0 | 74.4 | 69.8 |
Life Expectancy by health region in 2016
| Health Region | Province | Life Expectancy[6] | Male[6] | Female[6] |
|---|---|---|---|---|
| Eastern | 79.7 | 77.4 | 82.0 | |
| Central | 79.4 | 77.2 | 81.5 | |
| Western | 79.1 | 77.1 | 80.9 | |
| Labrador-Grenfell | 77.8 | 75.2 | 80.6 | |
| Prince Edward Island | 81.9 | 79.7 | 83.8 | |
| Western | 81.0 | 78.8 | 83.2 | |
| Northern | 80.0 | 78.0 | 81.9 | |
| Eastern | 78.5 | 75.5 | 81.6 | |
| Central | 81.4 | 79.2 | 83.3 | |
| Moncton | 81.8 | 79.6 | 83.8 | |
| Saint John | 80.2 | 78.2 | 82.1 | |
| Fredericton | 80.6 | 78.6 | 82.4 | |
| Edmundston | 80.1 | 77.7 | 81.9 | |
| Campbellton | 80.0 | 77.2 | 82.3 | |
| Bathurst | 81.2 | 78.7 | 83.7 | |
| Miramichi | 79.8 | 76.4 | 83.1 | |
| Bas-Saint-Laurent | 82.2 | 80.1 | 84.1 | |
| Saguenay - Lac-Saint-Jean | 82.2 | 80.4 | 83.9 | |
| Capitale-Nationale | 83.4 | 81.3 | 85.2 | |
| Mauricie et du Centre-du-Québec | 82.1 | 79.9 | 84.2 | |
| l'Estrie | 82.8 | 80.7 | 84.8 | |
| Montréal | 83.0 | 80.8 | 84.9 | |
| l'Outaouais | 81.6 | 79.5 | 83.5 | |
| l'Abitibi-Témiscamingue | 80.4 | 78.2 | 82.6 | |
| Côte-Nord | 81.1 | 79.0 | 83.2 | |
| Nord-du-Québec | 80.5 | 78.8 | 82.0 | |
| Gaspésie - Îles-de-la-Madeleine | 80.7 | 78.4 | 83.0 | |
| Chaudière-Appalaches | 83.2 | 81.3 | 84.9 | |
| Laval | 83.9 | 81.8 | 85.7 | |
| Lanaudière | 82.0 | 80.1 | 83.8 | |
| Laurentides | 82.0 | 80.2 | 83.7 | |
| Montérégie | 82.6 | 80.7 | 84.3 | |
| Nunavik | 69.7 | 67.4 | 71.4 | |
| Terres-Cries-de-la-Baie-James | 77.5 | 73.5 | 79.0 | |
| Algoma | 79.4 | 76.9 | 81.9 | |
| Brant | 80.4 | 78.6 | 82.2 | |
| Durham | 82.6 | 80.3 | 84.6 | |
| Elgin-St. Thomas | 80.3 | 78.4 | 82.0 | |
| Grey Bruce | 81.7 | 79.7 | 83.7 | |
| Haldimand-Norfolk | 80.8 | 78.8 | 82.8 | |
| Haliburton, Kawartha, Pine Ridge | 81.5 | 79.5 | 83.5 | |
| Halton | 84.3 | 82.4 | 85.9 | |
| Hamilton | 81.3 | 78.9 | 83.7 | |
| Hastings and Prince Edward | 80.1 | 77.6 | 82.7 | |
| Huron | 80.5 | 78.5 | 82.5 | |
| Chatham-Kent | 80.5 | 78.3 | 82.6 | |
| Kingston, Frontenac and Lennox and Addington | 81.5 | 79.5 | 83.3 | |
| Lambton | 80.8 | 78.4 | 83.3 | |
| Leeds, Grenville and Lanark | 81.3 | 79.4 | 83.0 | |
| Middlesex-London | 82.0 | 79.7 | 84.2 | |
| Niagara | 81.5 | 79.4 | 83.6 | |
| North Bay Parry Sound | 80.5 | 78.2 | 82.8 | |
| Northwestern | 77.2 | 75.5 | 78.9 | |
| Ottawa | 83.6 | 81.9 | 85.2 | |
| Oxford | 81.2 | 79.0 | 83.2 | |
| Peel | 84.9 | 83.1 | 86.4 | |
| Perth | 81.8 | 80.1 | 83.3 | |
| Peterborough | 81.6 | 79.5 | 83.6 | |
| Porcupine | 78.1 | 75.7 | 80.6 | |
| Renfrew | 81.3 | 79.1 | 83.2 | |
| Eastern | 81.0 | 78.9 | 83.1 | |
| Simcoe Muskoka | 81.6 | 79.8 | 83.5 | |
| Sudbury | 79.9 | 77.2 | 82.5 | |
| Thunder Bay | 78.9 | 76.8 | 80.9 | |
| Timiskaming | 78.8 | 75.6 | 81.8 | |
| Waterloo | 82.1 | 80.3 | 83.7 | |
| Wellington-Dufferin-Guelph | 81.9 | 80.1 | 83.6 | |
| Windsor-Essex | 81.7 | 79.7 | 83.6 | |
| York | 85.4 | 83.8 | 86.9 | |
| Toronto | 84.7 | 82.1 | 87.0 | |
| Winnipeg | 80.8 | 78.6 | 82.8 | |
| Prairie Mountain | 79.8 | 77.6 | 82.1 | |
| Interlake-Eastern | 80.0 | 78.1 | 82.1 | |
| Northern | 73.2 | 70.8 | 75.8 | |
| Southern | 81.4 | 79.1 | 83.7 | |
| Sun Country | 81.4 | 78.9 | 83.7 | |
| Five Hills | 80.7 | 78.1 | 83.2 | |
| Cypress | 81.8 | 79.1 | 84.1 | |
| Regina Qu'Appelle | 80.6 | 78.5 | 82.6 | |
| Sunrise | 79.3 | 76.4 | 82.5 | |
| Saskatoon | 81.1 | 78.8 | 83.3 | |
| Heartland | 79.8 | 77.0 | 82.6 | |
| Kelsey Trail | 79.6 | 77.6 | 81.4 | |
| Prince Albert Parkland | 79.0 | 76.1 | 82.2 | |
| Prarie North | 78.6 | 76.3 | 81.2 | |
| Mamawetan/Keewatin/Athabasca | 73.0 | 71.0 | 75.3 | |
| South | 80.0 | 77.8 | 82.2 | |
| Calgary | 83.5 | 81.6 | 85.4 | |
| Central | 79.6 | 77.1 | 82.3 | |
| Edmonton | 82.1 | 79.7 | 84.5 | |
| North | 79.0 | 77.0 | 81.3 | |
| East Kootenay | 80.8 | 78.9 | 82.8 | |
| Kootenay-Boundary | 80.2 | 77.6 | 83.0 | |
| Okanagan | 81.7 | 79.4 | 84.0 | |
| Thompson/Cariboo | 80.6 | 78.7 | 82.8 | |
| Fraser East | 81.2 | 79.0 | 83.4 | |
| Fraser North | 83.5 | 81.7 | 85.3 | |
| Fraser South | 83.1 | 81.0 | 85.1 | |
| Richmond | 87.1 | 85.9 | 88.1 | |
| Vancouver | 84.5 | 82.0 | 86.8 | |
| North Shore/Coast Garibaldi | 83.7 | 81.6 | 85.6 | |
| South Vancouver Island | 83.1 | 81.1 | 85.0 | |
| Central Vancouver Island | 81.4 | 79.1 | 83.6 | |
| North Vancouver Island | 81.2 | 78.6 | 83.8 | |
| Northwest | 79.9 | 77.2 | 83.0 | |
| Northern Interior | 79.2 | 77.3 | 81.5 | |
| Northeast | 79.0 | 76.7 | 81.4 | |
| Yukon | 79.0 | 76.0 | 82.1 | |
| Northwest Territories | 77.5 | 75.2 | 79.8 | |
| Nunavut | 71.8 | 70.3 | 73.1 |
See also
References
| Ranked | |
|---|---|
| Political | |
| Historical | |
| Other | |
This article is issued from Wikipedia. The text is licensed under Creative Commons - Attribution - Sharealike. Additional terms may apply for the media files.