List of countries by copper production
This is a list of countries by mined Copper production.
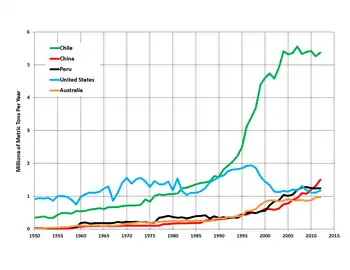
Production trends in the top five copper-producing countries, 1950-2012
Copper concentrates are commonly exported to other countries to be smelted. A nation's smelter production of copper can differ greatly from its mined production. See: List of countries by copper smelter production.
2017
| Rank | Country/region | Production (thousand tons of)[1][2] |
|---|---|---|
| World | 19,939 | |
| 1 | 5,503 | |
| 2 | 3,462 | |
| 3 | 1,656 | |
| 4 | 1,260 | |
| 5 | 1,094 | |
| 6 | 859 | |
| 7 | 797 | |
| 8 | 742 | |
| 9 | 705 | |
| 10 | 622 | |
| 11 | 620 | |
| 12 | 605 | |
| 13 | 540 | |
| 14 | 419 | |
| 15 | 384 | |
| 16 | 314 | |
| 17 | 204 | |
| 18 | 153 | |
2015
| Rank | Country/region | Production (thousand tons)[3] |
|---|---|---|
| World | 19,100 | |
| 1 | 5,760 | |
| 2 | 1,710 | |
| 3 | 1,700 | |
| 4 | 1,380 | |
| 5 | 1,020 | |
| 6 | 971 | |
| 7 | 732 | |
| 8 | 712 | |
| 9 | 697 | |
| 10 | 594 | |
| Other Countries | 3,800 |
2012
.svg.png.webp)
1907
| Rank | Country/region | Production (thousand tons)[4] |
|---|---|---|
| Worldwide | 723 | |
| 1 | 399 | |
| 2 | 61 | |
| 3 | 50 | |
| 4 | 50 | |
| 5 | 42 | |
| 6 | 27 | |
| 7 | 21 | |
| 8 | 15 |
See also
References
- Kay, Amanda (15 February 2018). "Top Copper Production by Country". Copper Investing News. Retrieved 29 June 2018.
- https://www.world-mining-data.info/?World_Mining_Data___Data_Section
- "Annual Publications - 2017: copper production in 2015" (PDF). USGS Minerals Information: Copper. USGS. 2017. Retrieved 28 March 2017.
- Encyclopædia Britannica, 11th ed. (1910), vol. 7, p. 109 - Copper. Production.—
Further reading
This article is issued from Wikipedia. The text is licensed under Creative Commons - Attribution - Sharealike. Additional terms may apply for the media files.