Payrac
Payrac is a commune in the Lot department in south-western France. The inhabitants of Payrac are called "Payraçois" and "Payraçoises".
Payrac | |
|---|---|
 A general view of Payrac | |
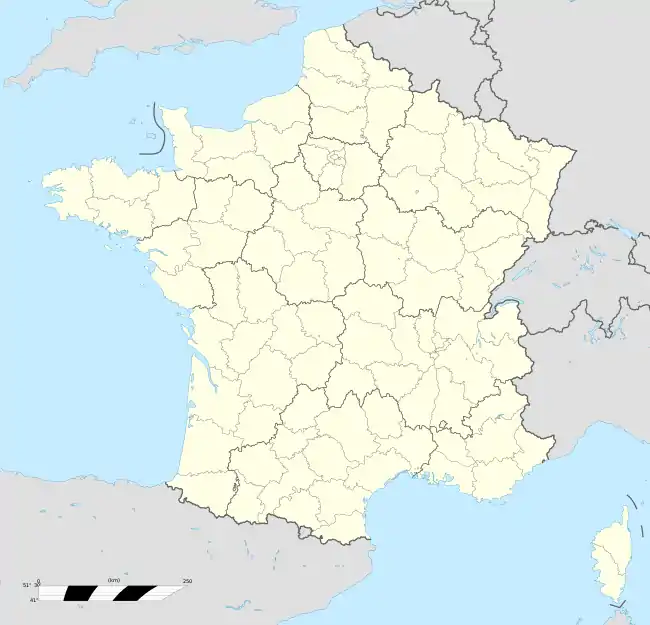
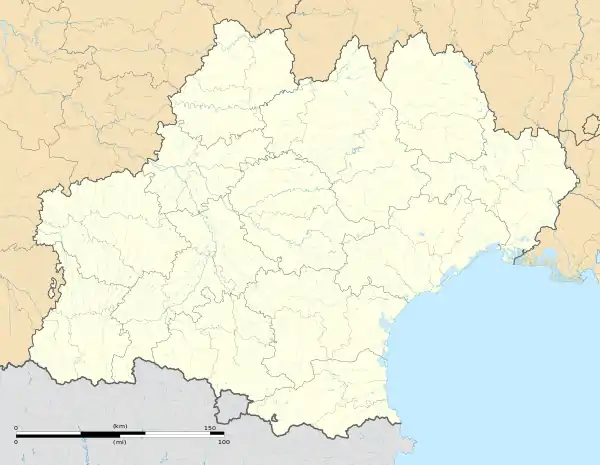
Location of Payrac 
| |
 Payrac  Payrac | |
| Coordinates: 44°47′51″N 1°28′22″E | |
| Country | France |
| Region | Occitanie |
| Department | Lot |
| Arrondissement | Gourdon |
| Canton | Souillac |
| Intercommunality | Haute Bouriane |
| Government | |
| • Mayor (2008–2014) | Jean-Pierre Favory |
| Area 1 | 19.5 km2 (7.5 sq mi) |
| Population (2017-01-01)[1] | 620 |
| • Density | 32/km2 (82/sq mi) |
| Time zone | UTC+01:00 (CET) |
| • Summer (DST) | UTC+02:00 (CEST) |
| INSEE/Postal code | 46215 /46350 |
| Elevation | 125–364 m (410–1,194 ft) (avg. 280 m or 920 ft) |
| 1 French Land Register data, which excludes lakes, ponds, glaciers > 1 km2 (0.386 sq mi or 247 acres) and river estuaries. | |
Bordering Towns
| Lamothe-Fénelon | Loupiac | Calès |
| Rouffilhac |  | |
| Anglars-Nozac | Le Vigan | Reilhaguet |
History
Payrac was an important town in the times of ancient Rome, but because of military campaigns and pillages from the Hundred Years' War and the Bubonic Plague, the town's population plummeted to the point where it was nearly uninhabited. Under the influence of lords, peasants moved to and repopulated Payrac.
In 1589, the Huguenot army ravaged Payrac and killed 500 people.
After this period, Payrac underwent an economic revival due to its strategic placement with Paris and Toulouse. Payrac did not undergo change during the Industrial Revolution, and as a result lost half its population.
Population
| Year | Pop. | ±% |
|---|---|---|
| 1793 | 1,017 | — |
| 1800 | 909 | −10.6% |
| 1806 | 1,160 | +27.6% |
| 1821 | 1,786 | +54.0% |
| 1831 | 1,809 | +1.3% |
| 1836 | 1,911 | +5.6% |
| 1841 | 1,253 | −34.4% |
| 1846 | 1,267 | +1.1% |
| 1851 | 1,265 | −0.2% |
| 1856 | 1,290 | +2.0% |
| 1861 | 1,320 | +2.3% |
| 1866 | 1,255 | −4.9% |
| 1872 | 1,240 | −1.2% |
| 1876 | 1,222 | −1.5% |
| 1881 | 1,185 | −3.0% |
| 1886 | 1,179 | −0.5% |
| 1891 | 1,136 | −3.6% |
| 1896 | 1,069 | −5.9% |
| 1901 | 980 | −8.3% |
| 1906 | 960 | −2.0% |
| 1911 | 968 | +0.8% |
| 1921 | 846 | −12.6% |
| 1926 | 816 | −3.5% |
| 1931 | 719 | −11.9% |
| 1936 | 687 | −4.5% |
| 1946 | 646 | −6.0% |
| 1954 | 580 | −10.2% |
| 1962 | 523 | −9.8% |
| 1968 | 512 | −2.1% |
| 1975 | 456 | −10.9% |
| 1982 | 448 | −1.8% |
| 1990 | 492 | +9.8% |
| 1999 | 564 | +14.6% |
| 2007 | 672 | +19.1% |
| 2012 | 639 | −4.9% |
| 2017 | 620 | −3.0% |
| Source: Cassini[2] et INSEE[3] | ||
See also
References
This article is issued from Wikipedia. The text is licensed under Creative Commons - Attribution - Sharealike. Additional terms may apply for the media files.