Rhode Island's 1st congressional district
Rhode Island's 1st congressional district is a congressional district in the U.S. state of Rhode Island. It includes all of Bristol and Newport counties, along with parts of Providence County, including most of the city of Providence.
| Rhode Island's 1st congressional district | |||
|---|---|---|---|
.tif.png.webp) Rhode Island's 1st congressional district since January 3, 2013 | |||
| Representative |
| ||
| Distribution |
| ||
| Population (2019) | 530,066 | ||
| Median household income | $66,652[1] | ||
| Ethnicity |
| ||
| Cook PVI | D+14[2] | ||
The district is currently represented by Democrat David Cicilline. In 2010, it was the least populous congressional district in the country.
Towns in the district
Bristol County: Barrington, Bristol, and Warren.
Newport County: Jamestown, Little Compton, Middletown, Newport, Portsmouth, and Tiverton.
Providence County: Central Falls, Cumberland, East Providence, Lincoln, North Providence, North Smithfield, Pawtucket, Providence (part), Smithfield, and Woonsocket.
Voter registration
| Voter registration and party enrollment as of November 1, 2012[3] | |||||
|---|---|---|---|---|---|
| Party | Active voters | Inactive voters | Total voters | Percentage | |
| Democratic | 156,784 | 11,392 | 168,176 | 40.39% | |
| Republican | 71,932 | 3,348 | 75,280 | 18.08% | |
| Unaffiliated | 161,327 | 11,299 | 172,626 | 41.46% | |
| Minor parties | 301 | 29 | 330 | 0.07% | |
| Total | 390,334 | 26,068 | 416,412 | 100% | |
Recent presidential elections
| Election results from presidential races | ||
|---|---|---|
| Year | Office | Results |
| 2000 | President | Al Gore 62 - George W. Bush 37% |
| 2004 | President | John Kerry 62 - George W. Bush 37% |
| 2008 | President | Barack Obama 65 - John McCain 33% |
| 2012 | President | Barack Obama 66 - Mitt Romney 32% |
| 2016 | President | Hillary Clinton 61 - Donald Trump 35% |
| 2020 | President | Joe Biden 64 - Donald Trump 35% |
Recent elections
2006 election
| Party | Candidate | Votes | % | ±% | |
|---|---|---|---|---|---|
| Democratic | Patrick Kennedy (incumbent) | 124,634 | 69.20 | +5.14 | |
| Republican | Jonathan Scott | 41,836 | 23.23 | -12.57 | |
| Independent | Kenneth Capalbo | 13,634 | 7.57 | ||
| Democratic hold | Swing | ||||
| Turnout | 180,104 | ||||
2008 election
| Party | Candidate | Votes | % | ±% | |
|---|---|---|---|---|---|
| Democratic | Patrick Kennedy (incumbent) | 145,254 | 68.52 | -0.68 | |
| Republican | Jonathan Scott | 51,340 | 24.22 | +0.99 | |
| Independent | Kenneth Capalbo | 15,108 | 7.13 | -0.44 | |
| Independent | Write-in votes | 296 | 0.14 | ||
| Democratic hold | Swing | ||||
| Turnout | 211,998 | ||||
2010 election
| Party | Candidate | Votes | % | ±% | |
|---|---|---|---|---|---|
| Democratic | David Cicilline | 81,269 | 50.54 | -17.98 | |
| Republican | John Loughlin | 71,542 | 44.49 | +20.27 | |
| Independent | Kenneth Capalbo | 6,424 | 3.99 | -3.14 | |
| Independent | Gregory Raposa | 1,334 | 1.13 | 0.83 | |
| Independent | Write-in votes | 245 | 0.15 | +0.01 | |
| Democratic hold | Swing | ||||
| Turnout | 160,814 | ||||
2012 election
| Party | Candidate | Votes | % | ±% | |
|---|---|---|---|---|---|
| Democratic | David Cicilline (incumbent) | 108,612 | 52.95 | +2.41 | |
| Republican | Brendan Doherty | 83,737 | 40.82 | -3.67 | |
| Independent | David Vogel | 12,504 | 6.10 | +2.11 | |
| Independent | Write-in votes | 262 | 0.13 | -0.02 | |
| Democratic hold | Swing | ||||
| Turnout | 205,115 | ||||
2014
| Party | Candidate | Votes | % | |
|---|---|---|---|---|
| Democratic | David Cicilline (incumbent) | 87,060 | 59.5 | |
| Republican | Cormick Lynch | 58,877 | 40.2 | |
| n/a | Write-ins | 416 | 0.3 | |
| Total votes | 146,353 | 100.0 | ||
| Democratic hold | ||||
2016
| Party | Candidate | Votes | % | |
|---|---|---|---|---|
| Democratic | David Cicilline (incumbent) | 130,540 | 64.5 | |
| Republican | Harold Russell Taub | 71,023 | 35.1 | |
| n/a | Write-ins | 814 | 0.4 | |
| Total votes | 202,371 | 100.0 | ||
| Democratic hold | ||||
2018
| Party | Candidate | Votes | % | |
|---|---|---|---|---|
| Democratic | David Cicilline (incumbent) | 116,099 | 66.7 | |
| Republican | Patrick Donovan | 57,567 | 33.1 | |
| n/a | Write-ins | 417 | 0.2 | |
| Total votes | 174,083 | 100.0 | ||
| Democratic hold | ||||
2020
| Party | Candidate | Votes | % | ||
|---|---|---|---|---|---|
| Democratic | David Cicilline (incumbent) | 158,550 | 70.8 | ||
| Independent | Jeffrey Lemire | 35,457 | 15.8 | ||
| Independent | Frederick Wysocki | 28,300 | 12.6 | ||
| Write-in | 1,553 | 0.7 | |||
| Total votes | 223,860 | 100.0 | |||
| Democratic hold | |||||
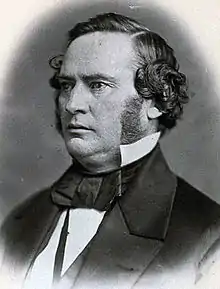
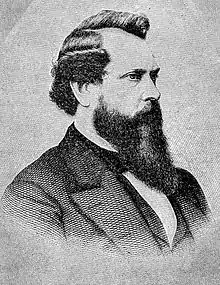
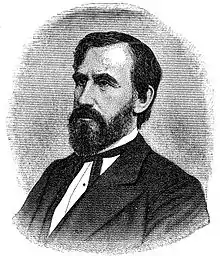
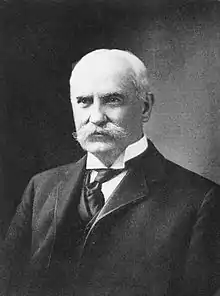
List of members representing the district
.jpg.webp)

.jpg.webp)
.jpg.webp)
.jpg.webp)

.jpg.webp)

.jpg.webp)
.jpg.webp)


Historical district boundaries
References
- https://www.census.gov/mycd/?st=44&cd=01
- "Partisan Voting Index – Districts of the 115th Congress" (PDF). The Cook Political Report. April 7, 2017. Retrieved April 7, 2017.
- "Registration and Party Enrollment Statistics as of November 1, 2012" (PDF). Rhode Island Board of Election. Archived from the original (PDF) on 2006-09-23. Retrieved 2012-11-01.
- "2014 General Election Statewide Summary". Rhode Island Board of Elections. 3 December 2014. Retrieved 17 January 2015.
- "2020 General Election - Statewide Summary". Rhode Island Board of Elections. Retrieved November 30, 2020.
- Martis, Kenneth C. (1989). The Historical Atlas of Political Parties in the United States Congress. New York: Macmillan Publishing Company.
- Martis, Kenneth C. (1982). The Historical Atlas of United States Congressional Districts. New York: Macmillan Publishing Company.
- Congressional Biographical Directory of the United States 1774–present
This article is issued from Wikipedia. The text is licensed under Creative Commons - Attribution - Sharealike. Additional terms may apply for the media files.