West Berkshire Council elections
West Berkshire is a unitary authority in Berkshire, England. Until 1 April 1998 it was a non-metropolitan district.
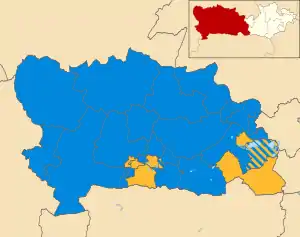
Map showing the composition of West Berkshire Council as of the last election in 2011. Conservatives in blue and Liberal Democrats in yellow.
Political control
Since the first election to the council in 1973 political control of the council has been held by the following parties:[1][2][3]
Non-metropolitan district
| Party in control | Years | |
|---|---|---|
| No overall control | 1973-1976 | |
| Conservative | 1976-1991 | |
| Liberal Democrats | 1991-1998 | |
Unitary authority
| Party in control | Years | |
|---|---|---|
| Liberal Democrats | 1997-2003 | |
| No overall control | 2003-2006 | |
| Conservative | 2006–present | |
Council elections
Non-metropolitan district elections
- 1973 Newbury District Council election
- 1976 Newbury District Council election
- 1979 Newbury District Council election
- 1983 Newbury District Council election (New ward boundaries)[4]
- 1987 Newbury District Council election
- 1991 Newbury District Council election (District boundary changes took place but the number of seats remained the same)[5][6]
- 1995 Newbury District Council election
Unitary authority elections
- 1997 West Berkshire Council election
| Year | Conservative | Liberal Democrats | Green | Independent | Notes | ||||
| 2000[7] | 25 | 28 | 0 | 1 | |||||
| 2003[8] | 26 | 26 | 0 | 0 | New ward boundaries[9][10] | ||||
| 2007[11] | 36 | 16 | 0 | 0 | |||||
| 2011[2] | 39 | 13 | 0 | 0 | |||||
| 2015[12] | 48 | 4 | 0 | 0 | |||||
| 2019[13] | 24 | 16 | 3 | 0 | New ward boundaries[14] | ||||
By-elections
"
| Party | Candidate | Votes | % | ±% | |
|---|---|---|---|---|---|
| Liberal Democrats | Jeffrey Charles George Brooks | 820 | 48.4% | +11.2% | |
| Conservative | Ellen Mary Crumly | 523 | 30.9% | -18.1% | |
| Labour | Louise Harriet Coulson | 130 | 7.7% | -6.2% | |
| Green | Jane Elisabeth Livermore | 130 | 7.7% | +7.7% | |
| UKIP | Gary Edward Johnson | 91 | 5.4% | +5.4% | |
| Registered electors | 4,957 | ||||
| Turnout | 1,702 | 34.3% | -34.3% | ||
| Liberal Democrats gain from Conservative | Swing | 14.7% | |||
District result maps
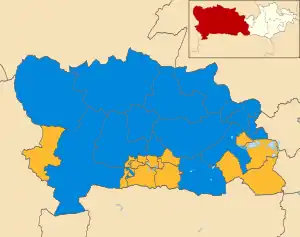 2003 results map
 2007 results map
- 2011 results map
References
- "Council compositions". The Elections Centre. Retrieved 3 May 2016.
- "England council elections". BBC News Online. 10 May 2011. Retrieved 25 December 2014.
- "English elect councils and mayors". BBC News Online. 7 May 2005. Retrieved 26 December 2014.
- The District of Newbury (Electoral Arrangements) Order 1979
- legislation.gov.uk - The Berkshire, Dorset and Wiltshire (County Boundaries) Order 1989. Retrieved on 5 November 2015.
- legislation.gov.uk - The Berkshire, Buckinghamshire, Hampshire, Oxfordshire and Surrey (County Boundaries) Order 1991. Retrieved on 5 November 2015.
- "West Berkshire". BBC News Online. Retrieved 25 December 2014.
- "Local elections". BBC News Online. Retrieved 25 December 2014.
- legislation.gov.uk - The District of West Berkshire (Electoral Changes) Order 2002. Retrieved on 4 October 2015.
- "Councillors". West Berkshire Council. Retrieved 25 December 2014.
- "West Berkshire". BBC News Online. 4 May 2007. Retrieved 25 December 2014.
- http://decisionmaking.westberks.gov.uk/mgElectionResults.aspx?ID=5&V=0&RPID=2796658
- "West Berkshire Council". BBC News.
- "The West Berkshire (Electoral Changes) Order 2018". www.legislation.gov.uk.
- "Declaration of Result of Poll". West Berkshire. 20 April 2018. Archived from the original on 21 April 2018. Retrieved 21 April 2018.
- "Election results for Thatcham West District Election 2015". West Berkshire. 8 May 2015. Archived from the original on 21 April 2018. Retrieved 21 April 2018.
External links
| Bracknell Forest Borough Council | |
|---|---|
| Reading Borough Council | |
| Slough Borough Council | |
| West Berkshire Council | |
| Windsor and Maidenhead Borough Council | |
| Wokingham Borough Council | |
| Berkshire County Council |
|
| |

This article is issued from Wikipedia. The text is licensed under Creative Commons - Attribution - Sharealike. Additional terms may apply for the media files.