1980 United States presidential election in North Dakota
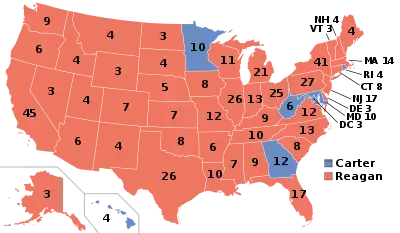
The 1980 United States presidential election in North Dakota took place on November 4, 1980. All 50 states and The District of Columbia were part of the 1980 United States presidential election. State voters chose 3 electors to the Electoral College, who voted for president and vice president.
| |||||||||||||||||||||||||||||||||
| |||||||||||||||||||||||||||||||||
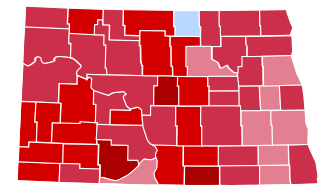 County Results
| |||||||||||||||||||||||||||||||||
| |||||||||||||||||||||||||||||||||

| Elections in North Dakota |
|---|
 |
North Dakota was won by former California Governor Ronald Reagan (R) by a 38-point landslide.[1] With 64.23% of the popular vote, North Dakota would prove to by Reagan's fourth strongest state after Utah, Idaho and Nebraska.[2]
As of the 2020 presidential election, this is the last election in which Sioux County voted for a Republican presidential candidate.[3]
Results
| Party | Candidate | Votes | % | |
|---|---|---|---|---|
| Republican | Ronald Reagan | 193,695 | 64.23% | |
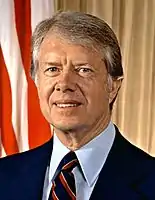
| Democratic | Jimmy Carter | 79,189 | 26.26% | |
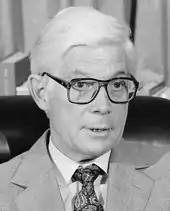
| Independent | John Anderson | 23,640 | 7.02% | |
| Libertarian | Edward Clark | 3,743 | 1.24% | |
| Citizens | Barry Commoner | 429 | 0.14% | |
| Independent | Harley McLain | 296 | 0.10% | |
| American | Percy Greaves Jr. | 235 | 0.08% | |
| Communist | Gus Hall | 93 | 0.03% | |
| Socialist Workers | Clifton DeBerry | 89 | 0.03% | |
| Socialist | David McReynolds | 82 | 0.03% | |
| Prohibition | Benjamin Bubar | 54 | 0.02% | |
| Total votes | 301,545 | 100.00% | ||
Results by county
| County[4] | Ronald Wilson Reagan Republican |
James Earl Carter Democratic |
John Bayard Anderson[5] Independent |
Edward E. Clark[5] Libertarian |
Various candidates[5] Other parties |
Margin | Total votes cast | ||||||
|---|---|---|---|---|---|---|---|---|---|---|---|---|---|
| # | % | # | % | # | % | # | % | # | % | # | % | ||
| Adams | 1,334 | 68.73% | 470 | 24.21% | 107 | 5.51% | 28 | 1.44% | 2 | 0.10% | 864 | 44.51% | 1,941 |
| Barnes | 4,392 | 59.79% | 2,128 | 28.97% | 705 | 9.60% | 84 | 1.14% | 37 | 0.50% | 2,264 | 30.82% | 7,346 |
| Benson | 2,149 | 59.91% | 1,119 | 31.20% | 262 | 7.30% | 50 | 1.39% | 7 | 0.20% | 1,030 | 28.71% | 3,587 |
| Billings | 524 | 76.05% | 122 | 17.71% | 33 | 4.79% | 9 | 1.31% | 1 | 0.15% | 402 | 58.35% | 689 |
| Bottineau | 3,394 | 70.30% | 1,090 | 22.58% | 267 | 5.53% | 66 | 1.37% | 11 | 0.23% | 2,304 | 47.72% | 4,828 |
| Bowman | 1,507 | 70.49% | 454 | 21.23% | 142 | 6.64% | 31 | 1.45% | 4 | 0.19% | 1,053 | 49.25% | 2,138 |
| Burke | 1,442 | 73.27% | 418 | 21.24% | 82 | 4.17% | 19 | 0.97% | 7 | 0.36% | 1,024 | 52.03% | 1,968 |
| Burleigh | 18,437 | 67.94% | 6,129 | 22.59% | 2,109 | 7.77% | 341 | 1.26% | 121 | 0.45% | 12,308 | 45.36% | 27,137 |
| Cass | 23,886 | 54.76% | 13,562 | 31.09% | 5,421 | 12.43% | 479 | 1.10% | 272 | 0.62% | 10,324 | 23.67% | 43,620 |
| Cavalier | 2,582 | 64.92% | 1,105 | 27.78% | 238 | 5.98% | 49 | 1.23% | 3 | 0.08% | 1,477 | 37.14% | 3,977 |
| Dickey | 2,455 | 68.69% | 917 | 25.66% | 161 | 4.50% | 38 | 1.06% | 3 | 0.08% | 1,538 | 43.03% | 3,574 |
| Divide | 1,267 | 66.06% | 509 | 26.54% | 109 | 5.68% | 27 | 1.41% | 6 | 0.31% | 758 | 39.52% | 1,918 |
| Dunn | 1,706 | 71.50% | 532 | 22.30% | 115 | 4.82% | 28 | 1.17% | 5 | 0.21% | 1,174 | 49.20% | 2,386 |
| Eddy | 1,153 | 61.23% | 539 | 28.62% | 145 | 7.70% | 37 | 1.96% | 9 | 0.48% | 614 | 32.61% | 1,883 |
| Emmons | 2,369 | 77.57% | 502 | 16.44% | 132 | 4.32% | 39 | 1.28% | 12 | 0.39% | 1,867 | 61.13% | 3,054 |
| Foster | 1,534 | 66.61% | 586 | 25.45% | 152 | 6.60% | 29 | 1.26% | 2 | 0.09% | 948 | 41.16% | 2,303 |
| Golden Valley | 1,006 | 74.57% | 259 | 19.20% | 62 | 4.60% | 20 | 1.48% | 2 | 0.15% | 747 | 55.37% | 1,349 |
| Grand Forks | 14,257 | 57.65% | 6,997 | 28.29% | 2,932 | 11.86% | 349 | 1.41% | 196 | 0.79% | 7,260 | 29.36% | 24,731 |
| Grant | 1,891 | 80.85% | 317 | 13.55% | 110 | 4.70% | 15 | 0.64% | 6 | 0.26% | 1,574 | 67.29% | 2,339 |
| Griggs | 1,342 | 61.84% | 636 | 29.31% | 158 | 7.28% | 27 | 1.24% | 7 | 0.32% | 706 | 32.53% | 2,170 |
| Hettinger | 1,699 | 75.28% | 434 | 19.23% | 104 | 4.61% | 15 | 0.66% | 5 | 0.22% | 1,265 | 56.05% | 2,257 |
| Kidder | 1,474 | 77.05% | 326 | 17.04% | 85 | 4.44% | 16 | 0.84% | 12 | 0.63% | 1,148 | 60.01% | 1,913 |
| LaMoure | 2,136 | 64.88% | 850 | 25.82% | 254 | 7.72% | 41 | 1.25% | 11 | 0.33% | 1,286 | 39.06% | 3,292 |
| Logan | 1,474 | 79.03% | 283 | 15.17% | 69 | 3.70% | 32 | 1.72% | 7 | 0.38% | 1,191 | 63.86% | 1,865 |
| McHenry | 2,922 | 71.20% | 939 | 22.88% | 190 | 4.63% | 44 | 1.07% | 9 | 0.22% | 1,983 | 48.32% | 4,104 |
| McIntosh | 2,471 | 86.01% | 308 | 10.72% | 72 | 2.51% | 14 | 0.49% | 8 | 0.28% | 2,163 | 75.29% | 2,873 |
| McKenzie | 2,265 | 67.25% | 867 | 25.74% | 182 | 5.40% | 49 | 1.45% | 5 | 0.15% | 1,398 | 41.51% | 3,368 |
| McLean | 4,234 | 67.79% | 1,613 | 25.82% | 318 | 5.09% | 71 | 1.14% | 10 | 0.16% | 2,621 | 41.96% | 6,246 |
| Mercer | 3,224 | 68.00% | 1,209 | 25.50% | 204 | 4.30% | 92 | 1.94% | 12 | 0.25% | 2,015 | 42.50% | 4,741 |
| Morton | 7,659 | 66.84% | 2,861 | 24.97% | 742 | 6.48% | 148 | 1.29% | 48 | 0.42% | 4,798 | 41.87% | 11,458 |
| Mountrail | 2,165 | 60.36% | 1,183 | 32.98% | 182 | 5.07% | 45 | 1.25% | 12 | 0.33% | 982 | 27.38% | 3,587 |
| Nelson | 1,611 | 62.08% | 726 | 27.98% | 226 | 8.71% | 23 | 0.89% | 9 | 0.35% | 885 | 34.10% | 2,595 |
| Oliver | 966 | 73.40% | 270 | 20.52% | 55 | 4.18% | 19 | 1.44% | 6 | 0.46% | 696 | 52.89% | 1,316 |
| Pembina | 3,101 | 65.73% | 1,239 | 26.26% | 303 | 6.42% | 67 | 1.42% | 8 | 0.17% | 1,862 | 39.47% | 4,718 |
| Pierce | 2,273 | 76.07% | 517 | 17.30% | 168 | 5.62% | 28 | 0.94% | 2 | 0.07% | 1,756 | 58.77% | 2,988 |
| Ramsey | 4,078 | 64.88% | 1,607 | 25.57% | 514 | 8.18% | 67 | 1.07% | 19 | 0.30% | 2,471 | 39.32% | 6,285 |
| Ransom | 1,883 | 59.93% | 974 | 31.00% | 237 | 7.54% | 44 | 1.40% | 4 | 0.13% | 909 | 28.93% | 3,142 |
| Renville | 1,154 | 62.65% | 570 | 30.94% | 98 | 5.32% | 18 | 0.98% | 2 | 0.11% | 584 | 31.70% | 1,842 |
| Richland | 5,711 | 61.17% | 2,698 | 28.90% | 750 | 8.03% | 152 | 1.63% | 26 | 0.28% | 3,013 | 32.27% | 9,337 |
| Rolette | 1,599 | 44.84% | 1,660 | 46.55% | 265 | 7.43% | 33 | 0.93% | 9 | 0.25% | -61 | -1.71% | 3,566 |
| Sargent | 1,565 | 55.44% | 1,048 | 37.12% | 174 | 6.16% | 29 | 1.03% | 7 | 0.25% | 517 | 18.31% | 2,823 |
| Sheridan | 1,326 | 82.51% | 208 | 12.94% | 65 | 4.04% | 4 | 0.25% | 4 | 0.25% | 1,118 | 69.57% | 1,607 |
| Sioux | 620 | 56.88% | 383 | 35.14% | 72 | 6.61% | 9 | 0.83% | 6 | 0.55% | 237 | 21.74% | 1,090 |
| Slope | 462 | 71.41% | 128 | 19.78% | 45 | 6.96% | 8 | 1.24% | 4 | 0.62% | 334 | 51.62% | 647 |
| Stark | 6,312 | 70.11% | 2,016 | 22.39% | 512 | 5.69% | 131 | 1.46% | 32 | 0.36% | 4,296 | 47.72% | 9,003 |
| Steele | 997 | 53.32% | 617 | 32.99% | 229 | 12.25% | 19 | 1.02% | 8 | 0.43% | 380 | 20.32% | 1,870 |
| Stutsman | 6,545 | 63.86% | 2,573 | 25.10% | 960 | 9.37% | 108 | 1.05% | 63 | 0.61% | 3,972 | 38.76% | 10,249 |
| Towner | 1,375 | 64.89% | 568 | 26.81% | 152 | 7.17% | 23 | 1.09% | 1 | 0.05% | 807 | 38.08% | 2,119 |
| Traill | 3,092 | 60.91% | 1,428 | 28.13% | 512 | 10.09% | 35 | 0.69% | 9 | 0.18% | 1,664 | 32.78% | 5,076 |
| Walsh | 4,488 | 64.69% | 1,850 | 26.66% | 485 | 6.99% | 98 | 1.41% | 17 | 0.25% | 2,638 | 38.02% | 6,938 |
| Ward | 14,997 | 67.59% | 5,554 | 25.03% | 1,234 | 5.56% | 328 | 1.48% | 76 | 0.34% | 9,443 | 42.56% | 22,189 |
| Wells | 2,660 | 73.91% | 746 | 20.73% | 148 | 4.11% | 38 | 1.06% | 7 | 0.19% | 1,914 | 53.18% | 3,599 |
| Williams | 6,530 | 65.93% | 2,545 | 25.70% | 592 | 5.98% | 130 | 1.31% | 107 | 1.08% | 3,985 | 40.24% | 9,904 |
| Totals | 193,695 | 64.23% | 79,189 | 26.26% | 23,640 | 7.84% | 3,743 | 1.24% | 1,278 | 0.42% | 114,506 | 37.97% | 301,545 |
References
- "1980 Presidential General Election Results - North Dakota". uselectionatlas.org. Retrieved May 20, 2015.
- "1980 Presidential Election Statistics". Dave Leip’s Atlas of U.S. Presidential Elections. Retrieved 2018-03-05.
- Sullivan, Robert David; ‘How the Red and Blue Map Evolved Over the Past Century’; America Magazine in The National Catholic Review; June 29, 2016
- Géoelections; 1980 Presidential Election Popular Vote (.xlsx file for €15)
- Géoelections; Popular Vote for John B. Anderson (.xlsx file for €15)
This article is issued from Wikipedia. The text is licensed under Creative Commons - Attribution - Sharealike. Additional terms may apply for the media files.