1996 Stevenage Borough Council election
Elections to Stevenage Council were held on 2 May 1996. One third of the council was up for election; the seats which were last contested in 1992. The Labour party stayed in overall control of the council. The council was one of a number where the Conservatives lost their last seats.[3]
| |||||||||||||||||||||||||
13 of the 39 seats to Stevenage Borough Council 20 seats needed for a majority | |||||||||||||||||||||||||
|---|---|---|---|---|---|---|---|---|---|---|---|---|---|---|---|---|---|---|---|---|---|---|---|---|---|
| |||||||||||||||||||||||||
 Map showing the results of contested wards in the 1996 Stevenage Borough Council elections. | |||||||||||||||||||||||||
| |||||||||||||||||||||||||
After the election, the composition of the council was
Election result
| Party | Seats | Gains | Losses | Net gain/loss | Seats % | Votes % | Votes | +/− | |
|---|---|---|---|---|---|---|---|---|---|
| Labour | 12 | 3 | 1 | 92.3 | 70.3 | 12,748 | |||
| Conservative | 0 | 0 | 3 | 0 | 18.6 | 3,468 | |||
| Militant Labour | 0 | 0 | 0 | 0 | 0 | 1.1 | 196 | New | |
| Social Democrat | 0 | 0 | 0 | 0 | 0 | 0 | |||
All comparisons in seats and vote share are to the corresponding 1992 election.
Ward results
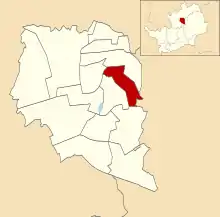
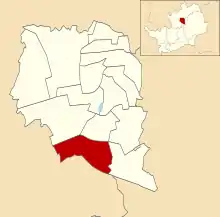
Bandley Hill
Location of Bandley Hill
| Party | Candidate | Votes | % | |
|---|---|---|---|---|
| Labour | Bob Woodward[6] | 1,175 | 68.2% | |
| Liberal Democrats | K. Lloyd | 220 | 12.8% | |
| Conservative | F. Warner | 187 | 10.9% | |
| Militant Labour | J. Horton | 141 | 8.2% | |
| Turnout | 29.2% | |||
| Labour hold | ||||
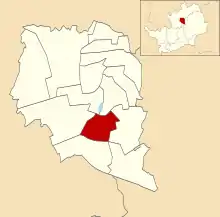
Bedwell Plash
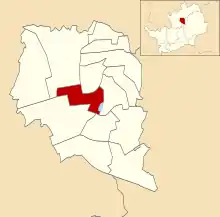
Location of Bedwell Plash ward
| Party | Candidate | Votes | % | |
|---|---|---|---|---|
| Labour | Michael Downing[6] | 1,086 | 79.9% | |
| Conservative | M. Wyatt | 170 | 12.5% | |
| Liberal Democrats | S. Grubert | 104 | 7.6% | |
| Turnout | 36.8% | |||
| Labour hold | ||||
Chells

Location of Chells ward
| Party | Candidate | Votes | % | |
|---|---|---|---|---|
| Labour | Ken Vale[6] | 879 | 84.8% | |
| Conservative | G. Hegan | 158 | 15.2% | |
| Turnout | 32.1% | |||
| Labour hold | ||||
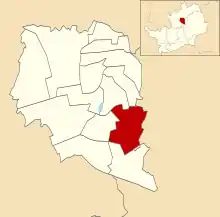
Longmeadow
Location of Longmeadow ward
| Party | Candidate | Votes | % | |
|---|---|---|---|---|
| Labour | Bruce Jackson[6] | 1,026 | 64.2% | |
| Conservative | R. Dimelow | 295 | 18.4% | |
| Liberal Democrats | M. Latham | 278 | 17.4% | |
| Turnout | 33.2% | |||
| Labour hold | ||||
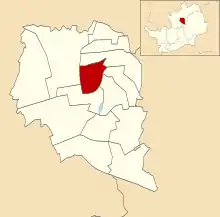
Martins Wood
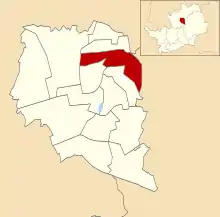
Location of Martins Wood ward
| Party | Candidate | Votes | % | |
|---|---|---|---|---|
| Labour | Michael P. Patston[6] | 1,269 | 64.6% | |
| Conservative | E. Hegan | 437 | 22.2% | |
| Liberal Democrats | B. Segadelli | 259 | 13.2% | |
| Turnout | 28.6% | |||
| Labour gain from Conservative | ||||
Mobbsbury
Location of Mobbsbury ward
| Party | Candidate | Votes | % | |
|---|---|---|---|---|
| Liberal Democrats | Robin G. Parker[6] | 847 | 50.4% | |
| Labour | J. Nadauld | 755 | 45.0% | |
| Conservative | S. Huetson | 77 | 4.6% | |
| Turnout | 54.2% | |||
| Liberal Democrats hold | ||||
Note: Mobbsbury ward was won by Labour at the last regular election in 1992, but gained by the Liberal Democrats in an unscheduled election in 1994.
Monkswood
Location of Monkswood ward
| Party | Candidate | Votes | % | |
|---|---|---|---|---|
| Labour | Liz Harrington[6] | 653 | 85.6% | |
| Conservative | P. Rushforth | 110 | 14.4% | |
| Turnout | 34.0% | |||
| Labour hold | ||||
Old Stevenage
Location of Old Stevenage ward
| Party | Candidate | Votes | % | |
|---|---|---|---|---|
| Labour | Pamela E.J. Gallagher[6] | 1,261 | 60.7% | |
| Conservative | P. McPartland | 815 | 39.3% | |
| Turnout | 37.7% | |||
| Labour gain from Conservative | ||||
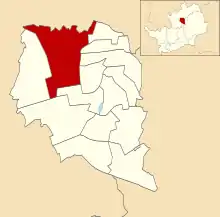
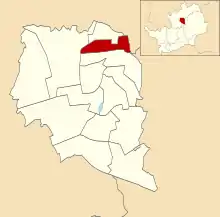
Pin Green
Location of Pin Green ward
| Party | Candidate | Votes | % | |
|---|---|---|---|---|
| Labour | Simon K. Speller[6] | 910 | 74.0% | |
| Conservative | M. Mason | 186 | 15.1% | |
| Liberal Democrats | J. Moorcroft | 133 | 10.8% | |
| Turnout | 34.7% | |||
| Labour hold | ||||
Roebuck
Location of Roebuck ward
| Party | Candidate | Votes | % | |
|---|---|---|---|---|
| Labour | Monika Cherney-Craw[6] | 871 | 69.4% | |
| Conservative | M. Hurst | 207 | 16.5% | |
| Liberal Democrats | J. Hamblin | 177 | 14.1% | |
| Turnout | 31.9% | |||
| Labour hold | ||||
St Nicholas
Location of St Nicholas ward
| Party | Candidate | Votes | % | |
|---|---|---|---|---|
| Labour | Bob Fowler[6] | 687 | 68.1% | |
| Liberal Democrats | M. Griffith | 166 | 16.5% | |
| Conservative | S. Woods | 156 | 15.5% | |
| Turnout | 29.1% | |||
| Labour hold | ||||
Shephall
Location of Shephall ward
| Party | Candidate | Votes | % | |
|---|---|---|---|---|
| Labour | Robert A. Clark[6] | 697 | 77.2% | |
| Conservative | M. Davies | 89 | 9.9% | |
| Liberal Democrats | G. Snell | 62 | 6.9% | |
| Militant Labour | M. Pickersgrill | 55 | 6.1% | |
| Turnout | 28.7% | |||
| Labour hold | ||||
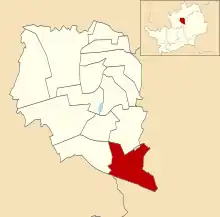
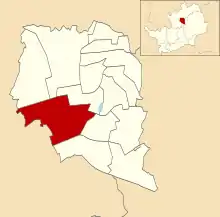
Symonds Green
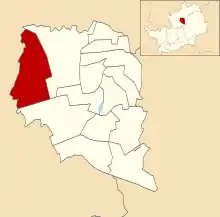
Location of Symonds Green ward
| Party | Candidate | Votes | % | |
|---|---|---|---|---|
| Labour | Tony T. Turner[6] | 1,479 | 71.8% | |
| Conservative | M. Notley | 581 | 28.2% | |
| Turnout | 37.3% | |||
| Labour gain from Conservative | ||||
References
- "Council compositions by year". The Elections Centre.
- "Local Election Summaries 1996". The Elections Centre.
- Millar, Frank (3 May 1996). "Tories suffer massive defeats in local elections". Irish Times. p. 10.
- "Complete list of results;Elections;Local". The Times. 4 May 1996. p. 1.
- "Stevenage Borough Council Election Results 1973–2012" (PDF). Retrieved 11 July 2019.
- "Members of the Council". Archived from the original on 8 November 2002. Retrieved 1 August 2019.
| Metropolitan boroughs |
|
|---|---|
| Unitary authorities |
|
| District councils |
|
| Ad-hoc election | |
This article is issued from Wikipedia. The text is licensed under Creative Commons - Attribution - Sharealike. Additional terms may apply for the media files.