2019 St Albans City and District Council election
The 2019 St Albans City and District Council election took place on 2 May 2019 to elect members of St Albans City and District Council in England.[1] This was on the same day as other local elections. At the elections, the Conservatives lost control of the council[2]
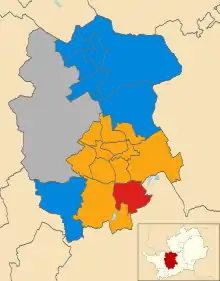
Map showing the winner in each ward for the 2019 St. Alban's City and District Council election
Summary Results
42,657
| Party | Seats | Gains | Losses | Net gain/loss | Seats % | Votes % | Votes | +/− | |
|---|---|---|---|---|---|---|---|---|---|
| Liberal Democrats | 25 | 7 | 0 | 42.1 | 17,971 | ||||
| Conservative | 23 | 0 | 8 | 30.3 | 12,943 | ||||
| Labour | 6 | 1 | 1 | 14.6 | 6,247 | ||||
| Independent | 3 | 1 | 0 | 2.7 | 1,153 | ||||
| Green | 1 | 0 | 0 | 10.3 | 4,343 | ||||
Ward Results
Ashley
| Party | Candidate | Votes | % | ±% | |
|---|---|---|---|---|---|
| Liberal Democrats | Iqbal Zia | 1,411 | 56.0 | -1.8 | |
| Labour | Mohammed Mortuza | 556 | 22.1 | -0.8 | |
| Green | Stephane Farenga | 308 | 12.2 | +6.2 | |
| Conservative | Yasmin-May Harisha | 244 | 9.7 | -3.7 | |
| Majority | 855 | 33.9 | -1.0 | ||
| Liberal Democrats hold | Swing | ||||
Batchwood
| Party | Candidate | Votes | % | ±% | |
|---|---|---|---|---|---|
| Liberal Democrats | Liz Needham | 878 | 39.5 | +16.2 | |
| Labour | Gordon Baisley | 755 | 33.9 | -16.3 | |
| Conservative | Alex Harisha-Clark | 381 | 17.1 | -3.5 | |
| Green | Anne McQuade | 210 | 9.4 | +3.9 | |
| Majority | 123 | 5.6 | -21.3 | ||
| Liberal Democrats gain from Conservative | Swing | ||||
Clarence
| Party | Candidate | Votes | % | ±% | |
|---|---|---|---|---|---|
| Liberal Democrats | Danny Clare | 1,521 | 63.9 | +6.1 | |
| Conservative | Don Deepthi | 357 | 15.0 | -7.5 | |
| Green | Catherine Michel | 252 | 10.6 | +3.9 | |
| Labour | Jagat Chatrath | 249 | 10.5 | -2.5 | |
| Majority | 1,164 | 48.9 | +13.6 | ||
| Liberal Democrats hold | Swing | ||||
Colney Heath
| Party | Candidate | Votes | % | ±% | |
|---|---|---|---|---|---|
| Liberal Democrats | Chris Brazier | 1,022 | 57.6 | +4.5 | |
| Conservative | Susan Devi | 421 | 23.7 | -3.3 | |
| Labour | Andrew Osborne | 174 | 9.8 | -5.3 | |
| Green | James Ryan | 157 | 8.9 | +4.0 | |
| Majority | 601 | 33.9 | +7.8 | ||
| Liberal Democrats hold | Swing | ||||
Cunningham
| Party | Candidate | Votes | % | ±% | |
|---|---|---|---|---|---|
| Liberal Democrats | Robert Donald | 1,132 | 54.6 | +16.8 | |
| Labour | Muhammad Rahim | 426 | 20.5 | -7.5 | |
| Conservative | Sarah Tallon | 372 | 17.9 | -7.7 | |
| Green | Greg Blom | 145 | 7.0 | +2.1 | |
| Majority | 706 | 34.1 | +24.3 | ||
| Liberal Democrats hold | Swing | ||||
Harpenden East
| Party | Candidate | Votes | % | ±% | |
|---|---|---|---|---|---|
| Conservative | Geoffrey Newman | 658 | 32.6 | -19.5 | |
| Liberal Democrats | Pip Liver | 608 | 30.1 | +0.1 | |
| Independent | Anne James | 406 | 20.1 | N/A | |
| Labour | James Gill | 179 | 8.9 | -9.0 | |
| Green | Angela Troughton | 168 | 8.3 | N/A | |
| Majority | 50 | 2.5 | -19.6 | ||
| Conservative hold | Swing | ||||
Harpenden North
| Party | Candidate | Votes | % | ±% | |
|---|---|---|---|---|---|
| Conservative | Bert Pawle | 818 | 44.9 | -6.1 | |
| Liberal Democrats | Melanie Priggen | 633 | 34.8 | +4.4 | |
| Green | Ian Troughton | 200 | 11.0 | +5.0 | |
| Labour | Emily Tilly | 169 | 9.3 | -3.2 | |
| Majority | 185 | 10.1 | -10.5 | ||
| Conservative hold | Swing | ||||
Harpenden South
| Party | Candidate | Votes | % | ±% | |
|---|---|---|---|---|---|
| Conservative | Brian Ellis | 994 | 54.2 | -10.1 | |
| Liberal Democrats | Zoe Frances Galvin | 382 | 20.8 | +3.8 | |
| Green | Rosalind Paul | 230 | 12.5 | +7.1 | |
| Labour | George Fraser | 227 | 12.4 | -0.9 | |
| Majority | 612 | 33.4 | -13.9 | ||
| Conservative hold | Swing | ||||
Harpenden West
| Party | Candidate | Votes | % | ±% | |
|---|---|---|---|---|---|
| Conservative | Roger Butterworth | 1,122 | 49.5 | -8.7 | |
| Liberal Democrats | Jeffrey Phillips | 622 | 27.4 | +4.0 | |
| Green | Lesley Baker | 311 | 13.7 | +8.4 | |
| Labour | Henry Meredith | 212 | 9.4 | -3.8 | |
| Majority | 500 | 22.1 | -12.7 | ||
| Conservative hold | Swing | ||||
London Colney
| Party | Candidate | Votes | % | ±% | |
|---|---|---|---|---|---|
| Labour | Helen Pakenham | 855 | 38.9 | ±0.0 | |
| Conservative | Liz Winstone | 749 | 34.1 | +2.5 | |
| Liberal Democrats | Tony Lillico | 403 | 18.4 | +2.5 | |
| Green | Mark Park-Crowne | 189 | 8.6 | +4.2 | |
| Majority | 106 | 4.8 | -2.5 | ||
| Labour gain from Conservative | Swing | ||||
Marshalswick North
| Party | Candidate | Votes | % | ±% | |
|---|---|---|---|---|---|
| Liberal Democrats | Clare Julien | 1,223 | 57.2 | +11.7 | |
| Conservative | Lyn Bolton | 549 | 25.7 | -9.3 | |
| Green | James Lomas | 193 | 9.0 | +3.3 | |
| Labour | Alexander Veitch | 173 | 8.1 | -5.7 | |
| Majority | 674 | 31.5 | +21.0 | ||
| Liberal Democrats gain from Conservative | Swing | ||||
Marshalswick South
| Party | Candidate | Votes | % | ±% | |
|---|---|---|---|---|---|
| Liberal Democrats | Karen Young | 1,461 | 53.7 | +12.5 | |
| Conservative | Salih Gaygusuz | 833 | 30.6 | -3.7 | |
| Labour | Richard Harris | 225 | 8.3 | -8.5 | |
| Green | Susana Garcia-Martinez | 204 | 7.5 | +2.1 | |
| Majority | 628 | 23.1 | +16.2 | ||
| Liberal Democrats gain from Conservative | Swing | ||||
Park Street
| Party | Candidate | Votes | % | ±% | |
|---|---|---|---|---|---|
| Liberal Democrats | Syed Abidi | 866 | 43.6 | +3.5 | |
| Conservative | Claudio Duran | 710 | 35.8 | -8.2 | |
| Green | Sally Leonard | 211 | 10.6 | +6.9 | |
| Labour | Gary Chambers | 198 | 10.0 | -2.3 | |
| Majority | 156 | 7.8 | +3.9 | ||
| Liberal Democrats gain from Conservative | Swing | ||||
Redbourn
| Party | Candidate | Votes | % | ±% | |
|---|---|---|---|---|---|
| Independent | David Mitchell | 747 | 41.2 | N/A | |
| Conservative | Ed Webster | 586 | 32.3 | -29.1 | |
| Labour | Symon Vergo | 245 | 13.5 | -5.0 | |
| Liberal Democrats | Will Jankowski | 234 | 12.9 | +0.4 | |
| Majority | 161 | 8.9 | -34.0 | ||
| Independent gain from Conservative | Swing | ||||
Sandridge
| Party | Candidate | Votes | % | ±% | |
|---|---|---|---|---|---|
| Conservative | Frances Leonard | 689 | 48.0 | -3.2 | |
| Liberal Democrats | Sharon Hollingsworth | 394 | 27.4 | +5.8 | |
| Green | Matthew Maddock | 199 | 13.9 | +2.7 | |
| Labour | Jonathan Hegerty | 154 | 10.7 | -5.3 | |
| Majority | 295 | 20.6 | -9.0 | ||
| Conservative hold | Swing | ||||
Sopwell
| Party | Candidate | Votes | % | ±% | |
|---|---|---|---|---|---|
| Liberal Democrats | Emma Matanle | 1,050 | 47.3 | -2.0 | |
| Liberal Democrats | Mandy McNeil | 1,018 | |||
| Labour | Iain Grant | 729 | 32.8 | -0.5 | |
| Labour | Eileen Harris | 720 | |||
| Conservative | Barry Sumpter | 233 | 10.5 | -2.7 | |
| Conservative | Graham Leonard | 215 | |||
| Green | Lucy Swift | 208 | 9.4 | +5.3 | |
| Green | Phil Fletcher | 189 | |||
| Majority | 289 | 14.5 | -1.5 | ||
| Liberal Democrats hold | Swing | ||||
| Liberal Democrats gain from Labour | Swing | ||||
St. Peters
| Party | Candidate | Votes | % | ±% | |
|---|---|---|---|---|---|
| Liberal Democrats | Will Tucker | 1,365 | 51.9 | +20.4 | |
| Conservative | Alec Campbell | 505 | 19.2 | -7.5 | |
| Green | Jill Mills | 495 | 18.9 | -10.2 | |
| Labour | Mark Ewington | 260 | 9.9 | -2.7 | |
| Majority | 860 | 32.7 | +30.3 | ||
| Liberal Democrats gain from Conservative | Swing | ||||
St. Stephen
| Party | Candidate | Votes | % | ±% | |
|---|---|---|---|---|---|
| Conservative | Dave Winstone | 1,006 | 52.8 | -10.7 | |
| Liberal Democrats | Sinead Howland | 527 | 27.7 | +5.7 | |
| Green | Caroline Hall | 217 | 11.4 | +6.8 | |
| Labour | Janet Blackwell | 154 | 8.1 | -1.8 | |
| Majority | 479 | 41.5 | -16.4 | ||
| Conservative hold | Swing | ||||
Verulam
| Party | Candidate | Votes | % | ±% | |
|---|---|---|---|---|---|
| Liberal Democrats | Stephen Barrett | 1,529 | 55.4 | -1.1 | |
| Conservative | Paul Verity | 865 | 31.3 | +0.9 | |
| Green | Candy Whittome | 213 | 7.7 | +3.7 | |
| Labour | Michael Bartlet | 153 | 5.5 | -3.6 | |
| Majority | 664 | 24.1 | -2.0 | ||
| Liberal Democrats gain from Conservative | Swing | ||||
Wheathampstead
| Party | Candidate | Votes | % | ±% | |
|---|---|---|---|---|---|
| Conservative | Sandra Wood | 851 | 43.7 | -22.4 | |
| Liberal Democrats | Gerard Panting | 710 | 36.4 | +22.1 | |
| Green | Oliver Hitch | 233 | 12.0 | +4.5 | |
| Labour | Neil Sankey | 154 | 7.9 | -4.2 | |
| Majority | 141 | 7.3 | -44.5 | ||
| Conservative hold | Swing | ||||
References
- "St Albans City and District Council". BBC. Retrieved 7 May 2019.
- "Election results: Conservatives lose control in St Albans". BBC. Retrieved 7 May 2019.
- "Local Council Elections 2 May 2019". St Albans City & District Council Election. Retrieved 7 May 2019.
This article is issued from Wikipedia. The text is licensed under Creative Commons - Attribution - Sharealike. Additional terms may apply for the media files.