2004 Plymouth City Council election
The 2004 Plymouth City Council election was held on 10 June 2004 to elect members of Plymouth City Council in England. This was on the same day as the other local elections. One third of the council was up for election and the Labour Party remained in control of the council.[1][2]
| |||||||||||||||||||||||||||||||||
19 of the 57 seats to Plymouth City Council 29 seats needed for a majority | |||||||||||||||||||||||||||||||||
|---|---|---|---|---|---|---|---|---|---|---|---|---|---|---|---|---|---|---|---|---|---|---|---|---|---|---|---|---|---|---|---|---|---|
| |||||||||||||||||||||||||||||||||
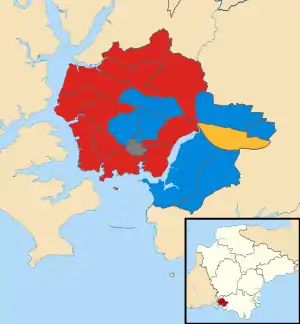 Map showing the results of contested wards in the 2004 Plymouth City Council elections. | |||||||||||||||||||||||||||||||||
| |||||||||||||||||||||||||||||||||
Overall results
| Party | Seats | Gains | Losses | Net gain/loss | Seats % | Votes % | Votes | +/− | |
|---|---|---|---|---|---|---|---|---|---|
| Labour | 11 | 0 | 1 | 57.9 | 32.1 | 20,511 | |||
| Conservative | 7 | 1 | 0 | 36.8 | 31.7 | 20,261 | |||
| Liberal Democrats | 1 | 0 | 0 | 0.0 | 18.6 | 11,862 | |||
| UKIP | 0 | 0 | 0 | 0.0 | 13.9 | 8,853 | |||
| Green | 0 | 0 | 0 | 0.0 | 1.8 | 1,171 | |||
| Independent | 0 | 0 | 0 | 0.0 | 1.2 | 796 | |||
| BNP | 0 | 0 | 0 | 0.0 | 0.6 | 379 | |||
| Total | 19 | 63,833 | |||||||
Ward results
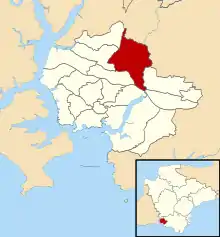
Budshead
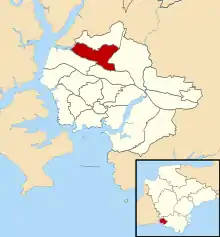
Location of Budshead ward
| Party | Candidate | Votes | % | |
|---|---|---|---|---|
| Labour | Christopher Mavin | 1,168 | 34.8% | |
| Conservative | Matthew Harrison | 1,007 | 30.0% | |
| UKIP | Thomas Williams | 702 | 20.9% | |
| Liberal Democrats | Trevor Addis | 478 | 14.2% | |
| Turnout | 3,355 | 34.9% | ||
| Labour hold | ||||
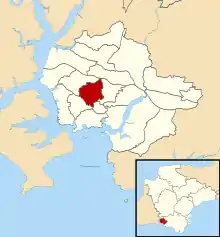
Compton
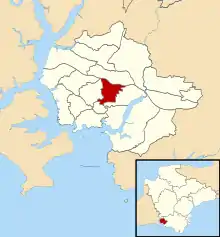
Location of Compton ward
| Party | Candidate | Votes | % | |
|---|---|---|---|---|
| Conservative | Thomas Savery | 1,519 | 40.9% | |
| Liberal Democrats | Ronald Casley | 855 | 23.0% | |
| Labour | Debra Roche | 757 | 20.4% | |
| UKIP | Ronald Coombes | 581 | 15.7% | |
| Turnout | 3,712 | 40.5% | ||
| Conservative hold | ||||
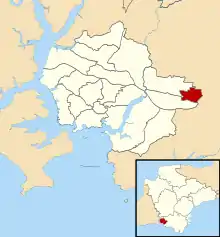
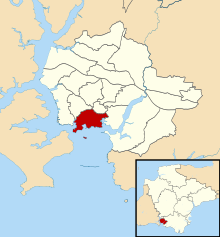
Devonport
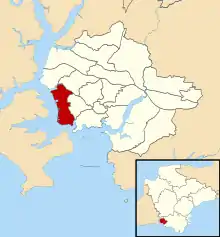
Location of Devonport ward
| Party | Candidate | Votes | % | |
|---|---|---|---|---|
| Labour | Nicola Wildy | 1,068 | 37.1% | |
| Conservative | James Bell | 630 | 21.9% | |
| UKIP | Sydney Brooks | 465 | 16.2% | |
| Liberal Democrats | John Brooks | 429 | 14.9% | |
| BNP | Graham Green | 191 | 6.6% | |
| Green | Wendy Miller | 93 | 3.2% | |
| Turnout | 2,876 | 29.3% | ||
| Labour hold | ||||
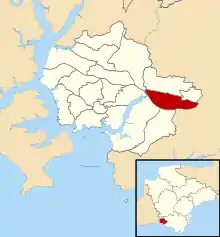
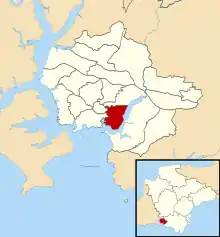
Efford and Lipson
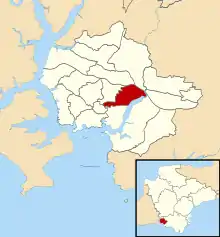
Location of Efford and Lipson ward
| Party | Candidate | Votes | % | |
|---|---|---|---|---|
| Labour | Brian Vincent | 1,649 | 50.1% | |
| Liberal Democrats | Lilli Miller | 843 | 25.6% | |
| Conservative | Mary Orchard | 802 | 24.3% | |
| Turnout | 3,294 | 34.4% | ||
| Labour hold | ||||
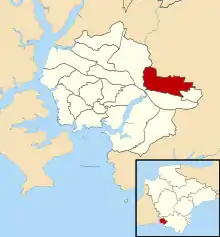
Eggbuckland
Location of Eggbuckland ward
| Party | Candidate | Votes | % | |
|---|---|---|---|---|
| Conservative | Peter Brookshaw | 1,190 | 30.9% | |
| Labour | Steven Lemin | 1,189 | 30.8% | |
| UKIP | Denis McCallum | 669 | 17.4% | |
| Liberal Democrats | Richard Fells | 480 | 12.5% | |
| Independent | Paul Rowe | 327 | 8.5% | |
| Turnout | 3,855 | 38.6% | ||
| Conservative gain from Labour | ||||
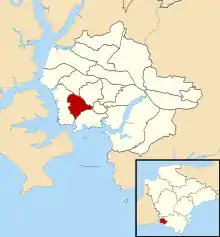
Ham
Location of Ham ward
| Party | Candidate | Votes | % | |
|---|---|---|---|---|
| Labour | Christopher Pattison | 1,379 | 43.7% | |
| UKIP | Anita Truman | 666 | 21.1% | |
| Conservative | Timothy Thomas | 642 | 20.3% | |
| Liberal Democrats | Kenneth Black | 471 | 14.9% | |
| Turnout | 3,158 | 32.4% | ||
| Labour hold | ||||
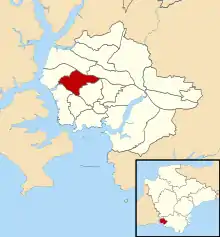
Honicknowle
Location of Honicknowle ward
| Party | Candidate | Votes | % | |
|---|---|---|---|---|
| Labour | Peter Smith | 1,604 | 53.3% | |
| Conservative | Gloria Bragg | 703 | 23.4% | |
| Liberal Democrats | Tara Smith | 700 | 23.3% | |
| Turnout | 3,007 | 29.8% | ||
| Labour hold | ||||
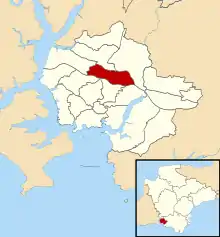
Moor View
Location of Moor View ward
| Party | Candidate | Votes | % | |
|---|---|---|---|---|
| Labour | Paul Hutchings | 1,344 | 40.3% | |
| Conservative | Brenda Brookshaw | 1,074 | 32.2% | |
| Liberal Democrats | Andrew Campbell | 921 | 27.6% | |
| Turnout | 3,339 | 35.4% | ||
| Labour hold | ||||
Peverell
Location of Peverell ward
| Party | Candidate | Votes | % | |
|---|---|---|---|---|
| Conservative | Patricia Nicholson | 1,494 | 35.6% | |
| Labour | Michael Robinson | 996 | 23.7% | |
| Liberal Democrats | Emma Swann | 812 | 19.4% | |
| UKIP | Carole Bragg | 613 | 14.6% | |
| Green | Frederick Allen | 279 | 6.7% | |
| Turnout | 4,194 | 42.8% | ||
| Labour hold | ||||
Plympton Chaddlewood
Location of Plympton Chaddlewood ward
| Party | Candidate | Votes | % | |
|---|---|---|---|---|
| Conservative | David Salter | 795 | 40.0% | |
| Liberal Democrats | Jonathan Byatt | 385 | 19.4% | |
| Labour | Valerie Burns | 362 | 18.2% | |
| UKIP | Jeremy Hill | 338 | 17.0% | |
| Independent | David Every | 107 | 5.4% | |
| Turnout | 1,987 | 32.5% | ||
| Conservative hold | ||||
Plympton Erle
Location of Plympton Erle ward
| Party | Candidate | Votes | % | |
|---|---|---|---|---|
| Liberal Democrats | Ernest Lock | 994 | 34.7% | |
| Conservative | Michael Foster | 840 | 29.3% | |
| UKIP | Alan Skuse | 547 | 19.1% | |
| Labour | Ross Burns | 484 | 16.9% | |
| Turnout | 2,865 | 41.4% | ||
| Liberal Democrats hold | ||||
Plympton St Mary
Location of Plympton St Mary ward
| Party | Candidate | Votes | % | |
|---|---|---|---|---|
| Conservative | Delia Ford | 1,659 | 40.8% | |
| UKIP | James Sanderson | 1,030 | 25.3% | |
| Labour | Juliet Henley | 783 | 19.2% | |
| Liberal Democrats | Stephen Kendrick | 598 | 14.7% | |
| Turnout | 4,070 | 42.2% | ||
| Conservative hold | ||||
Plymstock Dunstone
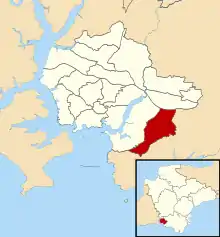
Location of Plymstock Dunstone ward
| Party | Candidate | Votes | % | |
|---|---|---|---|---|
| Conservative | Kevin Wigens | 1,961 | 46.8% | |
| UKIP | Stephen Winter | 935 | 22.3% | |
| Labour | Christopher Childs | 715 | 17.1% | |
| Liberal Democrats | Justin Robbins | 579 | 13.8% | |
| Turnout | 4,190 | 42.6% | ||
| Conservative hold | ||||
Plymstock Radford
Location of Plymstock Radford ward
| Party | Candidate | Votes | % | |
|---|---|---|---|---|
| Conservative | Michael Leaves | 1,673 | 41.4% | |
| UKIP | Roger Bullock | 862 | 21.3% | |
| Labour | Stephen Barker | 773 | 19.1% | |
| Liberal Democrats | Muriel Hawton | 546 | 13.5% | |
| BNP | Anthony Devereux | 188 | 4.7% | |
| Turnout | 43.6% | |||
| Conservative hold | ||||
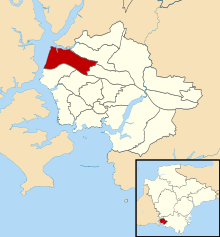
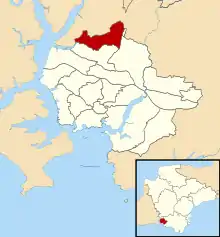
St Budeax
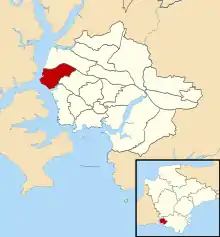
Location of St Budeaux ward
| Party | Candidate | Votes | % | |
|---|---|---|---|---|
| Labour | Dafydd Williams | 1,149 | 39.3% | |
| UKIP | Roger Benton | 792 | 27.1% | |
| Conservative | Janet Plymsol | 557 | 19.1% | |
| Liberal Democrats | Raymond McSweeney | 424 | 14.5% | |
| Turnout | 2,922 | 30.4% | ||
| Labour hold | ||||
St Peter and the Waterfront
Location of St Peter and the Waterfront ward
| Party | Candidate | Votes | % | |
|---|---|---|---|---|
| Labour | Valentine Hiromeris | 1,010 | 33.9% | |
| Conservative | Frederick Brimacombe | 857 | 28.8% | |
| Liberal Democrats | Christina MacCullie | 548 | 18.4% | |
| Independent | Raymond Rees | 206 | 6.9% | |
| Green | Frank Williamson | 201 | 6.7% | |
| Independent | Jo Jo | 156 | 5.2% | |
| Turnout | 2,978 | 30.9% | ||
| Labour hold | ||||
Southway
Location of Southway ward
| Party | Candidate | Votes | % | |
|---|---|---|---|---|
| Labour | David Weekes | 1,578 | 45.6% | |
| Conservative | Michael Gibson | 1,222 | 35.3% | |
| Liberal Democrats | Terrance O'Connor | 662 | 19.1% | |
| Turnout | 37.1% | |||
| Labour hold | ||||
Stoke
Location of Stoke ward
| Party | Candidate | Votes | % | |
|---|---|---|---|---|
| Labour | David Haydon | 1,259 | 35.4% | |
| Conservative | Grant Monaghan | 915 | 25.7% | |
| UKIP | Robert Saxton | 653 | 18.3% | |
| Liberal Democrats | John Davey | 504 | 14.2% | |
| Green | Jane Cavanagh | 230 | 6.5% | |
| Turnout | 3,561 | 36.9% | ||
| Labour hold | ||||
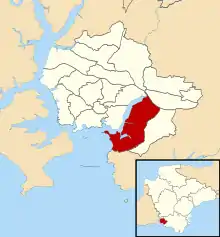
Sutton and Mount Gould
Location of Sutton and Mount Gould ward
| Party | Candidate | Votes | % | |
|---|---|---|---|---|
| Labour | Edwin Rennie | 1,244 | 41.9% | |
| Conservative | Edmund Shillabeer | 721 | 24.3% | |
| Liberal Democrats | Peter York | 633 | 21.3% | |
| Green | Tean Mitchell | 368 | 12.4% | |
| Turnout | 2,966 | 31.1% | ||
| Labour hold | ||||
References
This article is issued from Wikipedia. The text is licensed under Creative Commons - Attribution - Sharealike. Additional terms may apply for the media files.