2006 Plymouth City Council election
The 2006 Plymouth City Council election was held on 4 May 2006 to elect members of Plymouth City Council in England. One third of the council was up for election on the day, with an additional seat in Southway Ward remaining vacant until a by-election on 22 June. After the election, Labour were reduced to 28 out of the 56 filled seats, thus temporarily losing control of the council to No Overall Control.[4] However, Labour won the Southway by-election on 22 June, thus restoring their overall control of the council.[5]
| |||||||||||||||||||||||||||||||||||||
19 of the 57 seats to Plymouth City Council 29 seats needed for a majority | |||||||||||||||||||||||||||||||||||||
|---|---|---|---|---|---|---|---|---|---|---|---|---|---|---|---|---|---|---|---|---|---|---|---|---|---|---|---|---|---|---|---|---|---|---|---|---|---|
| |||||||||||||||||||||||||||||||||||||
 Map showing the results of contested wards in the 2006 Plymouth City Council elections. | |||||||||||||||||||||||||||||||||||||
| |||||||||||||||||||||||||||||||||||||
Overall results
| Party | Seats | Gains | Losses | Net gain/loss | Seats % | Votes % | Votes | +/− | |
|---|---|---|---|---|---|---|---|---|---|
| Conservative | 12 | 6 | 0 | 63.2 | 39.6% | 24,088 | |||
| Labour | 7 | 0 | 5 | 36.8 | 27.9% | 16,988 | |||
| Liberal Democrats | 0 | 0 | 1 | 0.0 | 19.5% | 11,864 | |||
| UKIP | 0 | 0 | 0 | 0.0 | 6.3% | 3,835 | |||
| Green | 0 | 0 | 0 | 0.0 | 4.0% | 2,422 | |||
| Independent | 0 | 0 | 0 | 0.0 | 2.5% | 1,495 | |||
| Respect | 0 | 0 | 0 | 0.0 | 0.2% | 112 | |||
| Total | 19 | 60,804 | |||||||
Ward results
Budshead
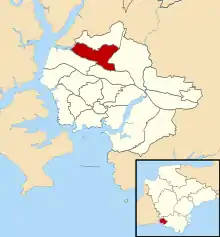
Location of Budshead ward
| Party | Candidate | Votes | % | |
|---|---|---|---|---|
| Conservative | Grant Monahan | 1,260 | 37.8% | |
| Labour | Bill Coleman | 1,052 | 31.5% | |
| Liberal Democrats | Janet Crocker | 541 | 16.2% | |
| UKIP | Carole Bragg | 483 | 14.5% | |
| Majority | 208 | 6.2% | ||
| Turnout | 3,336 | 35.7% | ||
| Conservative gain from Labour | ||||
Compton
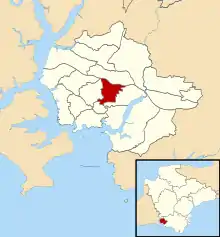
Location of Compton ward
| Party | Candidate | Votes | % | |
|---|---|---|---|---|
| Conservative | Ted Fry | 1,830 | 51.3% | |
| Liberal Democrats | Steven Smith | 840 | 23.6% | |
| Labour | Thomas Taylor | 549 | 15.4% | |
| Green | Nicola Bannon | 345 | 9.7% | |
| Majority | 990 | 27.8% | ||
| Turnout | 3,564 | 38.5% | ||
| Conservative hold | ||||
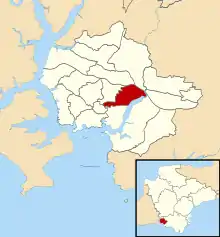
Devonport
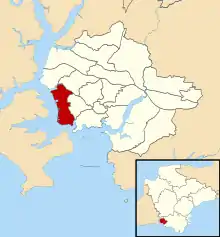
Location of Devonport ward
| Party | Candidate | Votes | % | |
|---|---|---|---|---|
| Labour | William Stevens | 968 | 34.5% | |
| Conservative | Jim Bell | 802 | 28.6% | |
| Liberal Democrats | Matthew Radmore | 396 | 14.1% | |
| Independent | William Goffin | 363 | 12.9% | |
| Green | Wendy Miller | 163 | 5.8% | |
| Respect | Andrew Symons | 112 | 4.0% | |
| Majority | 166 | 5.9% | ||
| Turnout | 2,804 | 29.3% | ||
| Labour hold | ||||
Drake
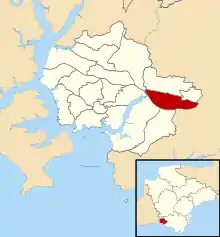
Location of Drake ward
| Party | Candidate | Votes | % | |
|---|---|---|---|---|
| Conservative | Steven Ricketts | 488 | 30.4% | |
| Liberal Democrats | Christina MacCullie | 361 | 22.5% | |
| Labour | Mark Coker | 323 | 20.1% | |
| Independent | David Santillo | 317 | 19.8% | |
| Green | Colin Bannon | 116 | 7.2% | |
| Majority | 127 | 7.9% | ||
| Turnout | 1,605 | 26.5% | ||
| Conservative gain from Liberal Democrats | ||||
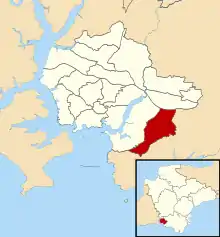
Efford and Lipson
Location of Efford and Lipson ward
| Party | Candidate | Votes | % | |
|---|---|---|---|---|
| Labour | Andrew Kerswell | 1,149 | 37.9% | |
| Conservative | Mary Orchard | 885 | 29.2% | |
| Liberal Democrats | Lilli Miller | 715 | 23.6% | |
| Green | Tean Mitchell | 284 | 9.4% | |
| Majority | 264 | 8.7% | ||
| Turnout | 3,033 | 31.8% | ||
| Labour hold | ||||
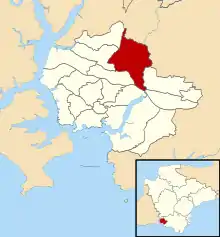
Eggbuckland
Location of Eggbuckland ward
| Party | Candidate | Votes | % | |
|---|---|---|---|---|
| Conservative | Ian Bowyer | 1,624 | 39.8% | |
| Liberal Democrats | Lee Finn | 1,037 | 25.4% | |
| Labour | Debbie Roche | 921 | 22.6% | |
| UKIP | Malcolm Hipwell | 355 | 8.7% | |
| Green | Colin Trier | 139 | 3.4% | |
| Majority | 587 | 14.4% | ||
| Turnout | 4,076 | 41.1% | ||
| Conservative gain from Labour | ||||
Ham
Location of Ham ward
| Party | Candidate | Votes | % | |
|---|---|---|---|---|
| Labour | Ian Gordon | 1,233 | 39.5% | |
| Conservative | Lynda Bowyer | 753 | 24.2% | |
| Liberal Democrats | Stephen Goldthorp | 498 | 16.0% | |
| UKIP | Julia Langmaid | 479 | 15.4% | |
| Green | Melanie Roach | 155 | 5.0% | |
| Majority | 480 | 15.4% | ||
| Turnout | 3,118 | 32.4% | ||
| Labour hold | ||||
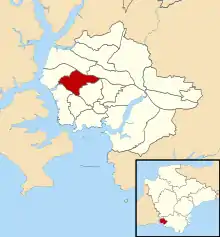
Honicknowle
Location of Honicknowle ward
| Party | Candidate | Votes | % | |
|---|---|---|---|---|
| Labour | Pauline Purnell | 1,191 | 38.7% | |
| Conservative | Eileen Willey | 666 | 21.7% | |
| UKIP | Michael Parr | 626 | 20.4% | |
| Liberal Democrats | Gillian Hirst | 593 | 19.3% | |
| Majority | 525 | 17.1% | ||
| Turnout | 3,076 | 31.0% | ||
| Labour hold | ||||
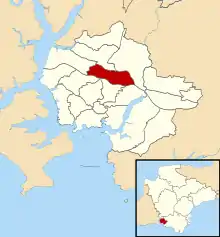
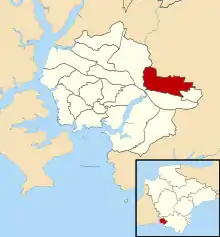
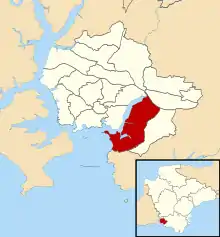
Moor View
Location of Moor View ward
| Party | Candidate | Votes | % | |
|---|---|---|---|---|
| Conservative | Michael Foster | 1,320 | 40.3% | |
| Labour | Michael Fox | 1,214 | 37.1% | |
| Liberal Democrats | Geoffrey Shepherdson | 740 | 22.6% | |
| Majority | 106 | 3.2% | ||
| Turnout | 3,274 | 35.3% | ||
| Conservative gain from Labour | ||||
Peverell
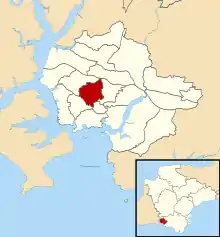
Location of Peverell ward
| Party | Candidate | Votes | % | |
|---|---|---|---|---|
| Conservative | Martin Leaves | 2,219 | 54.4% | |
| Liberal Democrats | Deborah Earl | 861 | 21.1% | |
| Labour | Anthony Portman | 617 | 15.1% | |
| Green | Don Allen | 381 | 9.3% | |
| Majority | 1,358 | 33.3% | ||
| Turnout | 4,078 | 41.1% | ||
| Labour hold | ||||
Plympton Chaddlewood
Location of Plympton Chaddlewood ward
| Party | Candidate | Votes | % | |
|---|---|---|---|---|
| Conservative | Glenn Jordan | 964 | 55.5% | |
| Liberal Democrats | Robert McVicar | 457 | 26.3% | |
| Labour | Ross Burns | 315 | 18.1% | |
| Majority | 507 | 29.2% | ||
| Turnout | 1,736 | 28.9% | ||
| Conservative hold | ||||
Plympton St Mary
Location of Plympton St Mary ward
| Party | Candidate | Votes | % | |
|---|---|---|---|---|
| Conservative | David James | 1,862 | 48.0% | |
| Liberal Democrats | Paul Rowe | 928 | 23.9% | |
| UKIP | James Sanderson | 548 | 14.1% | |
| Labour | John Sewell | 538 | 13.9% | |
| Majority | 934 | 24.1% | ||
| Turnout | 3,876 | 40.3% | ||
| Conservative hold | ||||
Plymstock Dunstone
Location of Plymstock Dunstone ward
| Party | Candidate | Votes | % | |
|---|---|---|---|---|
| Conservative | Vivien Pengelly | 2,434 | 62.7% | |
| Labour | Simon Barrett | 543 | 14.0% | |
| Liberal Democrats | Steven Turner | 539 | 13.9% | |
| UKIP | Hugh Williams | 366 | 9.4% | |
| Majority | 1,891 | 48.7% | ||
| Turnout | 3,882 | 39.9% | ||
| Conservative hold | ||||
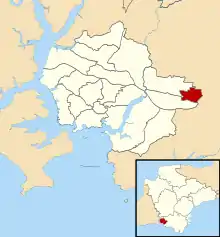
Plymstock Radford
Location of Plymstock Radford ward
| Party | Candidate | Votes | % | |
|---|---|---|---|---|
| Conservative | Wendy Foster | 1,801 | 48.0% | |
| Independent | Roger Dodd | 656 | 17.5% | |
| Liberal Democrats | Justin Robbins | 453 | 12.1% | |
| Labour | John Davey | 442 | 11.8% | |
| UKIP | Alan Skuse | 401 | 10.7% | |
| Majority | 1,145 | 30.5% | ||
| Turnout | 3,753 | 39.8% | ||
| Conservative hold | ||||
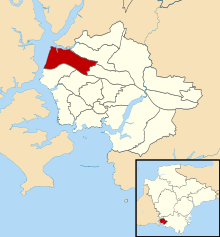
St Budeax
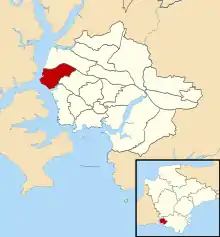
Location of St Budeaux ward
| Party | Candidate | Votes | % | |
|---|---|---|---|---|
| Labour | Sallyanne Letcher | 1,178 | 40.0% | |
| Conservative | Brian Roberts | 681 | 23.1% | |
| UKIP | Thomas Williams | 577 | 19.6% | |
| Liberal Democrats | Raymond McSweeney | 506 | 17.2% | |
| Majority | 497 | 16.9% | ||
| Turnout | 2,942 | 31.7% | ||
| Labour hold | ||||
St Peter and the Waterfront
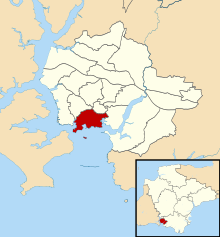
Location of St Peter and the Waterfront ward
| Party | Candidate | Votes | % | |
|---|---|---|---|---|
| Labour | Susan McDonald | 1,058 | 37.7% | |
| Conservative | Sally Stephens | 928 | 33.0% | |
| Liberal Democrats | Hugh Janes | 460 | 16.4% | |
| Green | Clare O'Neill | 205 | 7.3% | |
| Independent | Jo Jo | 159 | 5.7% | |
| Majority | 130 | 4.6% | ||
| Turnout | 2,810 | 30.8% | ||
| Labour hold | ||||
Southway
Location of Southway ward
| Party | Candidate | Votes | % | |
|---|---|---|---|---|
| Conservative | Thomas Browne | 1,400 | 40.2% | |
| Labour | James Kirk | 1,371 | 39.4% | |
| Liberal Democrats | Terrance O'Connor | 712 | 20.4% | |
| Majority | 29 | 0.8% | ||
| Turnout | 3,483 | 37.4% | ||
| Conservative gain from Labour | ||||
Stoke
Location of Stoke ward
| Party | Candidate | Votes | % | |
|---|---|---|---|---|
| Conservative | Jill Dolan | 1,358 | 39.0% | |
| Labour | Mark Lowry | 1,232 | 35.4% | |
| Liberal Democrats | Emma Swann | 552 | 15.9% | |
| Green | Hannah Ross | 338 | 9.7% | |
| Majority | 126 | 3.6% | ||
| Turnout | 3,480 | 36.4% | ||
| Conservative gain from Labour | ||||
Sutton and Mount Gould
Location of Sutton and Mount Gould ward
| Party | Candidate | Votes | % | |
|---|---|---|---|---|
| Labour | Mary Aspinall | 1,094 | 38.0% | |
| Conservative | Edmund Shillabeer | 813 | 28.2% | |
| Liberal Democrats | Peter York | 675 | 23.5% | |
| Green | Louise Parker | 296 | 10.3% | |
| Majority | 281 | 9.8% | ||
| Turnout | 2,878 | 30.4% | ||
| Labour hold | ||||
See also
References
- "Local elections 2006" (PDF). parliament.uk.
- "Local Election Results 2006". Andrew Teale.
- "Local elections: Plymouth". BBC News.
- "Labour loses control in Plymouth". BBC News. 5 May 2006.
- "Labour regains control of Plymouth city council". The Guardian. 23 June 2006.
This article is issued from Wikipedia. The text is licensed under Creative Commons - Attribution - Sharealike. Additional terms may apply for the media files.