2007 Norwich City Council election
The 2007 Norwich City Council election took place on 3 May 2007 to elect members of Norwich City Council in England. One third of seats (13) were up for election.[1] This was on the same day as other local elections.
| |||||||||||||||||||||||||||||||||||||||||||||||||||||
13 of 39 seats (One Third) to Norwich City Council 20 seats needed for a majority | |||||||||||||||||||||||||||||||||||||||||||||||||||||
|---|---|---|---|---|---|---|---|---|---|---|---|---|---|---|---|---|---|---|---|---|---|---|---|---|---|---|---|---|---|---|---|---|---|---|---|---|---|---|---|---|---|---|---|---|---|---|---|---|---|---|---|---|---|
| |||||||||||||||||||||||||||||||||||||||||||||||||||||
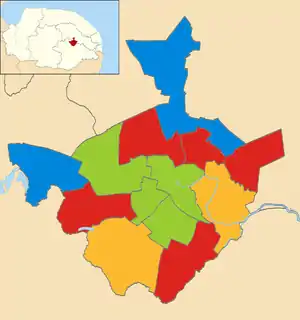 Map showing the 2007 local election results in Norwich. | |||||||||||||||||||||||||||||||||||||||||||||||||||||
| |||||||||||||||||||||||||||||||||||||||||||||||||||||
Election result
After the election, the new makeup of the City Council was:
- Labour 15 (-1)
- Liberal Democrat 11 (-1)
- Green 10 (+1)
- Conservative 3 (+1)
| Party | Seats | Gains | Losses | Net gain/loss | Seats % | Votes % | Votes | +/− | |
|---|---|---|---|---|---|---|---|---|---|
| Labour | 5 | –1 | 38.5 | 28.9 | 10,309 | ||||
| Green | 4 | +1 | 30.8 | 26.8 | 9,528 | ||||
| Liberal Democrats | 2 | –1 | 15.4 | 23.1 | 8,216 | ||||
| Conservative | 2 | +1 | 15.4 | 20.3 | 7,238 | ||||
| UKIP | 0 | ±0 | 0.9 | 327 | |||||
| Turnout | |||||||||
Ward results
Bowthorpe
| Party | Candidate | Votes | % | ±% | |
|---|---|---|---|---|---|
| Conservative | John Graham Wyatt | 975 | |||
| Labour | Chrissie Rumsby | 966 | |||
| Green | Blair Andrew Campbell | 337 | |||
| Liberal Democrats | Francis John McInvor | 282 | |||
| Majority | 9 | ||||
| Turnout | |||||
Catton Grove
| Party | Candidate | Votes | % | ±% | |
|---|---|---|---|---|---|
| Conservative | Evelyn Jean Collishaw | 1,003 | |||
| Labour | Martin Alexander Booth | 877 | |||
| Green | Penny Edwards | 313 | |||
| Liberal Democrats | Nesar Ahmed | 194 | |||
| Majority | 126 | ||||
| Turnout | |||||
Crome
| Party | Candidate | Votes | % | ±% | |
|---|---|---|---|---|---|
| Labour | Alan Waters | 1,110 | |||
| Conservative | Kay Frances Mason | 684 | |||
| Liberal Democrats | Irene Patricia Bowling | 402 | |||
| Green | Christopher Webb | 303 | |||
| Majority | 426 | ||||
| Turnout | |||||
Eaton
| Party | Candidate | Votes | % | ±% | |
|---|---|---|---|---|---|
| Liberal Democrats | Rosalind Mary Wright | 1,607 | |||
| Conservative | Vic Hopes | 1,303 | |||
| Labour | Ron Borrett | 467 | |||
| Green | Richard Andrew Bearman | 454 | |||
| UKIP | John Frederick Wilder | 117 | |||
| Majority | 304 | ||||
| Turnout | |||||
Lakenham
| Party | Candidate | Votes | % | ±% | |
|---|---|---|---|---|---|
| Labour | Keith Malcom Driver | 1,159 | |||
| Liberal Democrats | Gordon Richard Dean | 1,060 | |||
| Green | Jacqui McCarney | 293 | |||
| Conservative | Carrie Chandler | 290 | |||
| UKIP | Steve Emmens | 130 | |||
| Majority | 99 | ||||
| Turnout | |||||
Mancroft
| Party | Candidate | Votes | % | ±% | |
|---|---|---|---|---|---|
| Green | Tom Dylan | 1,027 | |||
| Labour | David Fullman | 687 | |||
| Liberal Democrats | Alan David Oliver | 481 | |||
| Conservative | Niki William George | 398 | |||
| Majority | 340 | ||||
| Turnout | |||||
Mile Cross
| Party | Candidate | Votes | % | ±% | |
|---|---|---|---|---|---|
| Labour | Steve Morphew | 1,013 | |||
| Liberal Democrats | Simon Richard Nobbs | 707 | |||
| Conservative | David John Mackie | 305 | |||
| Green | Christine Patricia Way | 298 | |||
| Majority | 306 | ||||
| Turnout | |||||
Nelson
| Party | Candidate | Votes | % | ±% | |
|---|---|---|---|---|---|
| Green | Adrian Philip Ramsay | 1,899 | 61.6 | ||
| Liberal Democrats | David Angus Fairbairn | 518 | 16.8 | ||
| Labour | Peter Bartram | 397 | 12.9 | ||
| Conservative | Malcolm Andrew Chamberlin | 271 | 8.8 | ||
| Majority | 1,381 | ||||
| Turnout | 3085 | ||||
Sewell
| Party | Candidate | Votes | % | ±% | |
|---|---|---|---|---|---|
| Labour | Julie Brociek-Coulton | 931 | |||
| Green | Penny Killingbeck | 573 | |||
| Conservative | Tony William Landamore | 453 | |||
| Liberal Democrats | Ian Robert Williams | 428 | |||
| Majority | 358 | ||||
| Turnout | |||||
Thorpe Hamlet
| Party | Candidate | Votes | % | ±% | |
|---|---|---|---|---|---|
| Liberal Democrats | Jeremy Nigel Hooke | 953 | |||
| Green | James Patrick Conway | 952 | |||
| Conservative | George Richards | 429 | |||
| Labour | John Holdcroft | 428 | |||
| Majority | 1 | ||||
| Turnout | |||||
Town Close
| Party | Candidate | Votes | % | ±% | |
|---|---|---|---|---|---|
| Green | Stephen Ralph Little | 1,474 | |||
| Liberal Democrats | Chris Thomas | 734 | |||
| Conservative | Eileen Olive Wyatt | 620 | |||
| Labour | Bob Sanderson | 497 | |||
| Majority | 740 | ||||
| Turnout | |||||
University
| Party | Candidate | Votes | % | ±% | |
|---|---|---|---|---|---|
| Labour | Roy George Blower | 1,155 | |||
| Liberal Democrats | James William Wright | 472 | |||
| Green | Ruth Alexandra Makoff | 368 | |||
| Conservative | Niall Graham Baxter | 227 | |||
| UKIP | Vandra Susan Ahlstrom | 80 | |||
| Majority | 683 | ||||
| Turnout | |||||
Wensum
| Party | Candidate | Votes | % | ±% | |
|---|---|---|---|---|---|
| Green | Rupert Jefferson Read | 1,237 | |||
| Labour | Ben Hathway | 622 | |||
| Liberal Democrats | Brian Ralph Clark | 378 | |||
| Conservative | Paul Anthony George Wells | 280 | |||
| Majority | 615 | ||||
| Turnout | |||||
References
- "Local Election Results 2007 - Norwich". Local Elections Archive Project. Retrieved 3 May 2016.
This article is issued from Wikipedia. The text is licensed under Creative Commons - Attribution - Sharealike. Additional terms may apply for the media files.