2007 Portsmouth City Council election
Elections to Portsmouth City Council were held on 3 May 2007. One third of the council was up for election and the council stayed under no overall control.
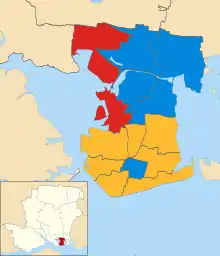
Results of the 2007 Portsmouth City Council election by ward
After the election, the composition of the council was
- Liberal Democrat 19
- Conservative 17
- Labour 5
- Independent 1
Election result
| Party | Seats | Gains | Losses | Net gain/loss | Seats % | Votes % | Votes | +/− | |
|---|---|---|---|---|---|---|---|---|---|
| Liberal Democrats | 7 | 1 | 1 | 0 | 50.0 | 33.9 | 14,706 | +0.3% | |
| Conservative | 5 | 1 | 0 | +1 | 35.7 | 40.6 | 17,611 | -1.7% | |
| Labour | 2 | 0 | 0 | 0 | 14.3 | 15.9 | 6,909 | -2.2% | |
| English Democrat | 0 | 0 | 0 | 0 | 0 | 5.9 | 2,563 | +4.9% | |
| Green | 0 | 0 | 0 | 0 | 0 | 2.5 | 1,069 | -0.7% | |
| Independent | 0 | 0 | 1 | -1 | 0 | 0.7 | 300 | -0.6% | |
| Respect | 0 | 0 | 0 | 0 | 0 | 0.5 | 207 | +0.0% | |
Ward results
Baffins
| Party | Candidate | Votes | % | ±% | |
|---|---|---|---|---|---|
| Liberal Democrats | Lynne Stagg | 1,601 | 45.5 | -0.1 | |
| Conservative | Jim Fleming | 1,211 | 34.4 | -0.4 | |
| Labour | Vicky Fry | 337 | 9.6 | -2.6 | |
| English Democrat | Stephen Male | 188 | 5.3 | +5.3 | |
| Green | Sarah Coote | 183 | 5.2 | -2.2 | |
| Majority | 390 | 11.1 | +0.3 | ||
| Turnout | 3,520 | 33.7 | -1.6 | ||
| Liberal Democrats gain from Independent | Swing | ||||
Central Southsea
| Party | Candidate | Votes | % | ±% | |
|---|---|---|---|---|---|
| Conservative | Margaret Adair | 1,284 | 37.6 | -1.9 | |
| Liberal Democrats | Debbie Tomes | 1,003 | 29.4 | -6.3 | |
| Labour | Donna Abrahart | 456 | 13.3 | +0.4 | |
| Green | Betty Burns | 374 | 10.9 | -0.9 | |
| Independent | Mark Austin | 300 | 8.8 | +8.8 | |
| Majority | 281 | 8.2 | +4.4 | ||
| Turnout | 3,417 | 34.1 | -2.3 | ||
| Conservative gain from Liberal Democrats | Swing | ||||
Charles Dickens
| Party | Candidate | Votes | % | ±% | |
|---|---|---|---|---|---|
| Liberal Democrats | Steven Wylie | 967 | 39.9 | -10.1 | |
| Labour | Keith Crabbe | 535 | 22.1 | -0.7 | |
| Conservative | Gerald Oldfield | 427 | 17.6 | -1.1 | |
| Respect | Lee Sprake | 207 | 8.5 | +0.0 | |
| English Democrat | David Farley | 158 | 6.5 | +6.5 | |
| Green | Darren Curtis | 130 | 5.4 | +5.4 | |
| Majority | 432 | 17.8 | -9.4 | ||
| Turnout | 2,424 | 24.9 | -1.5 | ||
| Liberal Democrats hold | Swing | ||||
Copnor
| Party | Candidate | Votes | % | ±% | |
|---|---|---|---|---|---|
| Conservative | Alan Langford | 1,289 | 46.3 | -0.1 | |
| Labour | Simon Payne | 525 | 18.9 | +0.3 | |
| Liberal Democrats | Beryl Wright | 488 | 17.5 | +0.5 | |
| English Democrat | David Knight | 482 | 17.3 | +3.6 | |
| Majority | 764 | 27.4 | -0.4 | ||
| Turnout | 2,784 | 28.3 | -4.2 | ||
| Conservative hold | Swing | ||||
Cosham
| Party | Candidate | Votes | % | ±% | |
|---|---|---|---|---|---|
| Conservative | Lee Mason | 1,439 | 49.0 | -5.5 | |
| Labour | Andy Silvester | 701 | 23.9 | -0.8 | |
| Liberal Democrats | Alan Webb | 488 | 16.6 | -4.2 | |
| English Democrat | David Ward | 307 | 10.5 | +10.5 | |
| Majority | 783 | 25.1 | -4.7 | ||
| Turnout | 2,935 | 29.8 | -4.0 | ||
| Conservative hold | Swing | ||||
Drayton and Farlington
| Party | Candidate | Votes | % | ±% | |
|---|---|---|---|---|---|
| Conservative | Robin Sparshatt | 2,453 | 59.4 | -1.9 | |
| Liberal Democrats | Patrick Whittle | 944 | 22.8 | -5.8 | |
| Labour | Sarah Cook | 396 | 9.6 | -0.5 | |
| English Democrat | Alan Wakeford | 339 | 8.2 | +8.2 | |
| Majority | 1,509 | 36.6 | +3.9 | ||
| Turnout | 4,132 | 41.7 | -2.2 | ||
| Conservative hold | Swing | ||||
Eastney and Craneswater
| Party | Candidate | Votes | % | ±% | |
|---|---|---|---|---|---|
| Liberal Democrats | Terry Hall | 1,961 | 54.8 | +9.1 | |
| Conservative | Mike Lowery | 1,378 | 38.5 | -7.7 | |
| Labour | John Ferrett | 237 | 6.6 | -1.6 | |
| Majority | 583 | 16.3 | |||
| Turnout | 3,576 | 38.1 | +0.5 | ||
| Liberal Democrats hold | Swing | ||||
Fratton
| Party | Candidate | Votes | % | ±% | |
|---|---|---|---|---|---|
| Liberal Democrats | Eleanor Scott | 1,391 | 56.0 | -3.8 | |
| Conservative | Angus Ross | 571 | 23.0 | -4.9 | |
| Labour | Simon Bramwell | 310 | 12.5 | +0.2 | |
| English Democrat | Richard Glew | 212 | 8.5 | +8.5 | |
| Majority | 820 | 33.0 | +1.1 | ||
| Turnout | 2,484 | 25.4 | -1.4 | ||
| Liberal Democrats hold | Swing | ||||
Hilsea
| Party | Candidate | Votes | % | ±% | |
|---|---|---|---|---|---|
| Conservative | Alistair Thompson | 1,736 | 58.0 | -2.8 | |
| Labour | Michelle Treacher | 660 | 22.0 | -4.4 | |
| Liberal Democrats | Phillip Smith | 325 | 10.9 | -1.9 | |
| English Democrat | Alan Green | 273 | 9.1 | +9.1 | |
| Majority | 1,076 | 36.0 | +1.6 | ||
| Turnout | 2,994 | 30.3 | -4.2 | ||
| Conservative hold | Swing | ||||
Milton
| Party | Candidate | Votes | % | ±% | |
|---|---|---|---|---|---|
| Liberal Democrats | Gerald Vernon-Jackson | 1,681 | 43.3 | +2.0 | |
| Conservative | Sarah Dinenage | 1,644 | 42.4 | +2.9 | |
| Labour | Ken Ferrett | 235 | 6.1 | -3.1 | |
| Green | Alan Bish | 214 | 5.5 | -4.5 | |
| English Democrat | Matthew Clark | 104 | 2.7 | +2.7 | |
| Majority | 37 | 0.9 | -0.9 | ||
| Turnout | 3,878 | 40.2 | +4.5 | ||
| Liberal Democrats hold | Swing | ||||
Nelson
| Party | Candidate | Votes | % | ±% | |
|---|---|---|---|---|---|
| Labour | Leo Madden | 840 | 31.9 | -7.4 | |
| Liberal Democrats | Alex Naylor | 717 | 27.2 | +7.4 | |
| Conservative | Selina Corkerton | 711 | 27.0 | -3.9 | |
| English Democrat | Kevin Baker | 199 | 7.6 | +7.6 | |
| Green | Calum Kennedy | 168 | 6.4 | -3.6 | |
| Majority | 123 | 4.7 | -3.7 | ||
| Turnout | 2,635 | 26.3 | -0.8 | ||
| Labour hold | Swing | ||||
Paulsgrove
| Party | Candidate | Votes | % | ±% | |
|---|---|---|---|---|---|
| Labour | David Horne | 1,135 | 46.7 | -3.0 | |
| Conservative | James Williams | 765 | 31.5 | -2.8 | |
| English Democrat | Clive Percy | 301 | 12.4 | +12.4 | |
| Liberal Democrats | Jason Nelson | 230 | 9.5 | -6.4 | |
| Majority | 370 | 15.2 | -0.2 | ||
| Turnout | 2,431 | 25.0 | -2.8 | ||
| Labour hold | Swing | ||||
St Jude
| Party | Candidate | Votes | % | ±% | |
|---|---|---|---|---|---|
| Liberal Democrats | David Butler | 1,341 | 47.0 | +11.2 | |
| Conservative | Jackie Ciccarone | 1,258 | 44.0 | +5.2 | |
| Labour | Alwin Oliver | 257 | 9.0 | +3.1 | |
| Majority | 83 | 3.0 | |||
| Turnout | 2,856 | 33.0 | -0.6 | ||
| Liberal Democrats hold | Swing | ||||
St Thomas
| Party | Candidate | Votes | % | ±% | |
|---|---|---|---|---|---|
| Liberal Democrats | Les Stevens | 1,569 | 47.6 | +3.0 | |
| Conservative | Sandra Theresa | 1,445 | 43.8 | +2.3 | |
| Labour | John Speigelhalter | 285 | 8.6 | -5.4 | |
| Majority | 124 | 3.8 | +0.7 | ||
| Turnout | 3299 | 34.8 | -1.0 | ||
| Liberal Democrats hold | Swing | ||||
References
| Preceded by 2006 Portsmouth City Council election |
Portsmouth City Council elections | Succeeded by 2008 Portsmouth City Council election |
This article is issued from Wikipedia. The text is licensed under Creative Commons - Attribution - Sharealike. Additional terms may apply for the media files.