California's 10th congressional district
California's 10th congressional district is a congressional district in the U.S. state of California. Currently, the 10th district encompasses part of the northern San Joaquin Valley.
| California's 10th congressional district | |||
|---|---|---|---|
.tif.png.webp) California's 10th congressional district since January 3, 2013 | |||
| Representative |
| ||
| Population (2019) | 764,859 | ||
| Median household income | $69,647[1] | ||
| Ethnicity |
| ||
| Cook PVI | EVEN[3] | ||
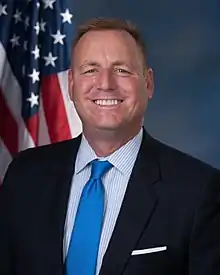
Democrat and businessman Josh Harder defeated incumbent Republican Jeff Denham in the 2018 midterm elections and is the current representative for the district.
The district includes all of Stanislaus County and part of San Joaquin County. It is centered on Modesto. Cities in the district include Oakdale, Manteca, Modesto, Tracy, and Turlock.[4]
History
Until 2012
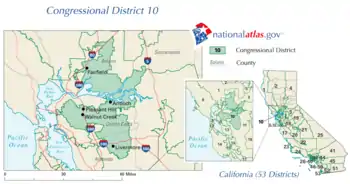
Prior to redistricting by the California Citizens Redistricting Commission going into effect in 2012, the 10th district stretched from Livermore to Dixon and the outskirts of Vacaville. It consisted of portions of Alameda, Contra Costa, Sacramento, and Solano Counties.
The 10th district received national attention in 1996 when Democrat Ellen Tauscher defeated incumbent Republican Bill Baker.[5]
In the 2002 redistricting of California, all seats were made safe[6] for the parties of incumbent officeholders. The district boundaries were extended to include parts of Solano County, southwestern Sacramento County, eastern Contra Costa County and El Cerrito in western Contra Costa County. Although much of the suburban Tri-Valley region was lost to the 11th Congressional District, the city of Livermore remained in the 10th at Tauscher's request (as a member of the U.S. House Committee on Energy and Commerce, she had some oversight responsibilities over the U.S. Department of Energy, and hence indirectly of Lawrence Livermore National Laboratory).
On June 26, 2009, Tauscher resigned her seat to be sworn in as Undersecretary of State for Arms Control and International Security.[7][8][9] In the ensuing special election held on November 3, 2009, former Democratic Lieutenant Governor John Garamendi won the seat over Republican David Harmer 53.0% to 42.7%. Immediately following redistricting, Garamendi successfully ran for re-election in California's 3rd congressional district, which shares many municipalities with the 2002 version of the 10th district (e.g. Vacaville and Fairfield), but lies significantly northwest of the current 10th district.
2012 – present
The current 10th congressional district includes all of Stanislaus County (including Ceres, Oakdale, Modesto, Riverbank, and Turlock) and the southern portion of San Joaquin County (including Tracy and Manteca).[4]
This went into effect in 2012, as the result of redistricting by the California Citizens Redistricting Commission. The new 10th includes much of the core of the old 18th district (Modesto, Ceres, and the southwestern half of Stanislaus County), though the 18th also included a substantial portion of Stockton. It also shares much of the northwestern portion of the old 19th district (Turlock, Riverbank, Oakdale, and the rest of northeastern Stanislaus County).
Republican Jeff Denham transferred from the 19th District to the new 10th. He held it for three terms until being defeated in 2018 by Democrat Josh Harder.
Election results from statewide races
1992 – 2020
| Year | Office | Results |
|---|---|---|
| 1992 | President | Clinton 42.4 - 35.6% |
| Senator | Boxer 48.0 - 42.5% | |
| Senator | Feinstein 56.9 - 37.7% | |
| 1994 | Governor[10] | Wilson 59.7 - 37.1% |
| Senator[11] | Feinstein 52.3 - 42.0% | |
| 1996 | President[12] | Clinton 48.2 - 42.6% |
| 1998 | Governor[13] | Davis 56.0 - 41.3% |
| Senator[14] | Boxer 50.2 - 46.8% | |
| 2000 | President[15] | Gore 51.3 - 44.8% |
| Senator[16] | Feinstein 55.8 - 40.0% | |
| 2002 | Governor[17] | Davis 49.9 - 39.1% |
| 2003 | Recall[18][19] | No 52.6 - 47.4% |
| Schwarzenegger 42.2 - 34.7% | ||
| 2004 | President[20] | Kerry 58.5 - 40.4% |
| Senator[21] | Boxer 60.1 - 36.6% | |
| 2006 | Governor[22] | Schwarzenegger 56.2 - 38.7% |
| Senator[23] | Feinstein 65.5 - 30.0% | |
| 2008 | President[24] | Obama 64.7 - 33.1% |
| 2010 | Governor | Brown 57.4 - 38.7% |
| Senator | Boxer 56.0 - 39.4% | |
| 2012 | President | Obama 50.6 - 47.0% |
| Senator[25] | Feinstein 52.1 - 47.9% | |
| 2014 | Governor[26] | Brown 51.7 - 48.3% |
| 2016 | President | Clinton 48.5 - 45.5% |
| Senator[27] | Harris 57.1 - 42.9% | |
| 2018 | Governor[28] | Cox 50.5 - 49.5% |
| Senator[29] | de Leon 56.9 - 43.1% | |
| 2020 | President | Biden 50.3 - 47.4% |
Competitiveness
Voter Registration Statistics
The California Secretary of State publishes reports on California voter registration on a regular basis. Before the 2018 primary election, they published a report dating May 21, 2018.
| Date | Democratic | Republican | American Independent | Green | Libertarian | No Party Preference |
|---|---|---|---|---|---|---|
| May 21, 2018[30] | 127,878 | 117,900 | 10,011 | 959 | 2,484 | 70,251 |
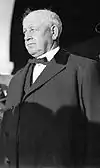
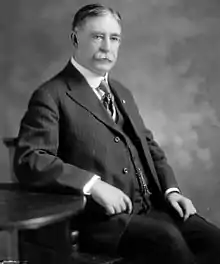
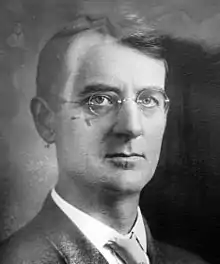
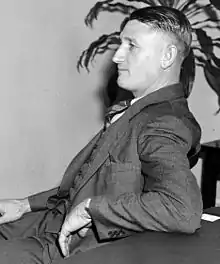
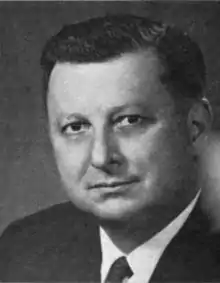
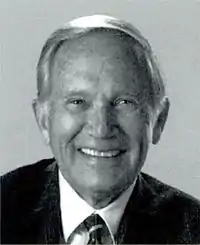
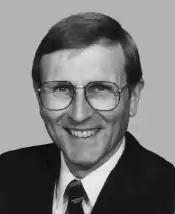
List of members representing the district
.jpg.webp)
.jpg.webp)
.jpg.webp)
.jpg.webp)

Election results for representatives
1912
| Party | Candidate | Votes | % | |
|---|---|---|---|---|
| Progressive | William Stephens (Incumbent) | 43,637 | 53.4 | |
| Democratic | George Ringo | 17,890 | 21.9 | |
| Socialist | Fred C. Wheeler | 17,126 | 21.0 | |
| Prohibition | Emory D. Martindale | 2,995 | 3.7 | |
| Total votes | 81,648 | 100.0 | ||
| Turnout | ||||
| Progressive hold | ||||
1914
| Party | Candidate | Votes | % | |
|---|---|---|---|---|
| Progressive | William Stephens (Incumbent) | 44,141 | 38.4 | |
| Republican | Henry Z. Osborne | 33,172 | 28.9 | |
| Democratic | Nathan Newby | 17,810 | 15.5 | |
| Socialist | Ralph L. Criswell | 14,900 | 13.0 | |
| Prohibition | Henry Clay Needham | 4,903 | 4.3 | |
| Total votes | 70,926 | 100.0 | ||
| Turnout | ||||
| Progressive hold | ||||
1916 (Special)
| Candidate | Votes | % | |
|---|---|---|---|
| Henry S. Benedict (write-in) | 34.8 | ||
| James H. Ryckman (write-in) | 21.9 | ||
| Henry Clay Needham (write-in) | 21.3 | ||
| Joy Clark (write-in) | 17.4 | ||
| George Clark (write-in) | 2.6 | ||
| Rufus V. Bowden (write-in) | 1.3 | ||
| John C. Wray (write-in) | 0.7 | ||
| Total votes | 100.0 | ||
| Voter turnout | % | ||
1916
| Party | Candidate | Votes | % | |
|---|---|---|---|---|
| Republican | Henry Z. Osborne | 63,913 | 49.5 | |
| Democratic | Rufus W. Bowden | 33,225 | 25.7 | |
| Progressive | Henry Stanley Benedict | 14,305 | 11.1 | |
| Socialist | James H. Ryckman | 9,000 | 7.0 | |
| Prohibition | Henry Clay Needham | 8,781 | 6.8 | |
| Total votes | 129,224 | 100.0 | ||
| Turnout | ||||
| Republican hold | ||||
1918
| Party | Candidate | Votes | % | |
|---|---|---|---|---|
| Republican | Henry Z. Osborne (Incumbent) | 72,773 | 88.2 | |
| Socialist | James H. Ryckman | 9,725 | 11.8 | |
| Total votes | 82,498 | 100.0 | ||
| Turnout | ||||
| Republican hold | ||||
1920
| Party | Candidate | Votes | % | |
|---|---|---|---|---|
| Republican | Henry Z. Osborne (Incumbent) | 97,469 | 82.7 | |
| Socialist | Upton Sinclair | 20,439 | 17.3 | |
| Total votes | 117,908 | 100.0 | ||
| Turnout | ||||
| Republican hold | ||||
1922
| Party | Candidate | Votes | % | |
|---|---|---|---|---|
| Republican | Henry Z. Osborne (Incumbent) | 98,739 | 100.0 | |
| Turnout | ||||
| Republican hold | ||||
1923 (Special)
Republican John D. Fredericks won the special election to replace fellow Republican Henry Z. Osborne, who died in office. Data for this special election is not available.[34]
1924
| Party | Candidate | Votes | % | |
|---|---|---|---|---|
| Republican | John D. Fredericks (Incumbent) | 133,780 | 62.3 | |
| Democratic | Robert W. Richardson | 80,870 | 37.7 | |
| Total votes | 214,650 | 100.0 | ||
| Turnout | ||||
| Republican hold | ||||
1926
| Party | Candidate | Votes | % | |
|---|---|---|---|---|
| Republican | Joe Crail (Incumbent) | 144,677 | 86.8 | |
| Socialist | N. Jackson Wright | 21,997 | 13.2 | |
| Total votes | 166,674 | 100.0 | ||
| Turnout | ||||
| Republican hold | ||||
1928
| Party | Candidate | Votes | % | |
|---|---|---|---|---|
| Republican | Joe Crail (Incumbent) | 301,028 | 93.9 | |
| Democratic | Harry Sherr | 19,659 | 6.1 | |
| Total votes | 320,687 | 100.0 | ||
| Turnout | ||||
| Republican hold | ||||
1930
| Party | Candidate | Votes | % | |
|---|---|---|---|---|
| Republican | Joe Crail (Incumbent) | 162,502 | 75 | |
| Democratic | John F. Dockweiler | 54,231 | 25 | |
| Total votes | 216,733 | 100 | ||
| Turnout | ||||
| Republican hold | ||||
1932
| Party | Candidate | Votes | % | ||
|---|---|---|---|---|---|
| Democratic | Henry E. Stubbs | 50,390 | 55.3 | ||
| Republican | Arthur S. Crites | 40,794 | 44.7 | ||
| Total votes | 91,184 | 100.0 | |||
| Turnout | |||||
| Democratic win (new seat) | |||||
1934
| Party | Candidate | Votes | % | |
|---|---|---|---|---|
| Democratic | Henry E. Stubbs (Incumbent) | 68,475 | 64.4 | |
| Republican | George R. Bliss | 37,860 | 35.6 | |
| Total votes | 106,335 | 100.0 | ||
| Turnout | ||||
| Democratic hold | ||||
1936
| Party | Candidate | Votes | % | |
|---|---|---|---|---|
| Democratic | Henry E. Stubbs (Incumbent) | 72,476 | 69.6 | |
| Republican | George R. Bliss | 31,700 | 30.4 | |
| Total votes | 104,176 | 100.0 | ||
| Turnout | ||||
| Democratic hold | ||||
1937 (Special)
Democrat Alfred J. Elliott won the special election to replace fellow Democrat Henry E. Stubbs, who died in office. Data for this special election is not available.[42]
1938
| Party | Candidate | Votes | % | |
|---|---|---|---|---|
| Democratic | Alfred J. Elliott (Incumbent) | 84,791 | 67.3 | |
| Republican | F. Fred Hoelscher | 41,194 | 32.7 | |
| Total votes | 125,985 | 100.0 | ||
| Turnout | ||||
| Democratic hold | ||||
1940
| Party | Candidate | Votes | % | |
|---|---|---|---|---|
| Democratic | Alfred J. Elliott (Incumbent) | 125,845 | 97 | |
| Communist | Louretta Adams | 3,826 | 3 | |
| Total votes | 129,671 | 100 | ||
| Turnout | ||||
| Democratic hold | ||||
1942
| Party | Candidate | Votes | % | |
|---|---|---|---|---|
| Democratic | Alfred J. Elliott (Incumbent) | 43,864 | 100.0 | |
| Turnout | ||||
| Democratic hold | ||||
1944
| Party | Candidate | Votes | % | |
|---|---|---|---|---|
| Democratic | Alfred J. Elliott (Incumbent) | 60,001 | 100.0 | |
| Turnout | ||||
| Democratic hold | ||||
1946
| Party | Candidate | Votes | % | |
|---|---|---|---|---|
| Democratic | Alfred J. Elliott (Incumbent) | 51,843 | 100.0 | |
| Turnout | ||||
| Democratic hold | ||||
1948
| Party | Candidate | Votes | % | |||
|---|---|---|---|---|---|---|
| Republican | Thomas H. Werdel | 67,448 | 71.3 | |||
| Progressive | Sam James Miller | 27,168 | 28.7 | |||
| Total votes | 94,616 | 100.0 | ||||
| Turnout | ||||||
| Republican gain from Democratic | ||||||
1950
| Party | Candidate | Votes | % | |
|---|---|---|---|---|
| Republican | Thomas H. Werdel (Incumbent) | 59,313 | 53.6 | |
| Democratic | Harlan Hagen | 51,409 | 46.4 | |
| Total votes | 110,722 | 100.0 | ||
| Turnout | ||||
| Republican hold | ||||
1952
| Party | Candidate | Votes | % | |
|---|---|---|---|---|
| Republican | Charles S. Gubser | 106,375 | 59.2 | |
| Democratic | Arthur L. Johnson | 70,271 | 39.1 | |
| Progressive | Betsey K. Fisher | 2,939 | 1.7 | |
| Total votes | 179,585 | 100.0 | ||
| Turnout | ||||
| Republican hold | ||||
1954
| Party | Candidate | Votes | % | |
|---|---|---|---|---|
| Republican | Charles S. Gubser (Incumbent) | 94,418 | 61.2 | |
| Democratic | Paul V. Birmingham | 59,843 | 38.8 | |
| Total votes | 154,261 | 100.0 | ||
| Turnout | ||||
| Republican hold | ||||
1956
| Party | Candidate | Votes | % | |
|---|---|---|---|---|
| Republican | Charles S. Gubser (Incumbent) | 128,891 | 60.7 | |
| Democratic | William H. Vatcher | 83,586 | 39.3 | |
| Total votes | 212,477 | 100.0 | ||
| Turnout | ||||
| Republican hold | ||||
1958
| Party | Candidate | Votes | % | |
|---|---|---|---|---|
| Republican | Charles S. Gubser (Incumbent) | 118,715 | 54.6 | |
| Democratic | Russell B. Bryan | 98,894 | 45.4 | |
| Total votes | 217,609 | 100.0 | ||
| Turnout | ||||
| Republican hold | ||||
1960
| Party | Candidate | Votes | % | |
|---|---|---|---|---|
| Republican | Charles S. Gubser (Incumbent) | 170,063 | 58.9 | |
| Democratic | Russell B. Bryan | 118,520 | 41.1 | |
| Total votes | 288,583 | 100.0 | ||
| Turnout | ||||
| Republican hold | ||||
1962
| Party | Candidate | Votes | % | |
|---|---|---|---|---|
| Republican | Charles S. Gubser (Incumbent) | 106,419 | 57.4 | |
| Democratic | James P. Thurber Jr. | 68,885 | 42.6 | |
| Total votes | 175,304 | 100.0 | ||
| Turnout | ||||
| Republican hold | ||||
1964
| Party | Candidate | Votes | % | |
|---|---|---|---|---|
| Republican | Charles S. Gubser (Incumbent) | 151,027 | 63.1 | |
| Democratic | E. Day Carman | 88,240 | 36.9 | |
| Total votes | 239,267 | 100.0 | ||
| Turnout | ||||
| Republican hold | ||||
1966
| Party | Candidate | Votes | % | |
|---|---|---|---|---|
| Republican | Charles S. Gubser (Incumbent) | 156,549 | 69.1 | |
| Democratic | George Leppert | 70,013 | 30.9 | |
| Total votes | 226,562 | 100.0 | ||
| Turnout | ||||
| Republican hold | ||||
1968
| Party | Candidate | Votes | % | |
|---|---|---|---|---|
| Republican | Charles S. Gubser (Incumbent) | 160,204 | 67.3 | |
| Democratic | Grayson S. Taketa | 73,530 | 30.9 | |
| Peace and Freedom | Martin L. Primach | 4,276 | 1.8 | |
| Total votes | 238,010 | 100.0 | ||
| Turnout | ||||
| Republican hold | ||||
1970
| Party | Candidate | Votes | % | |
|---|---|---|---|---|
| Republican | Charles S. Gubser (Incumbent) | 135,864 | 62.0 | |
| Democratic | Stuart. D. McLean | 80,530 | 36.8 | |
| American Independent | Joyce W. Stancliffe | 2,651 | 1.2 | |
| Total votes | 219,045 | 100.0 | ||
| Turnout | ||||
| Republican hold | ||||
1972
| Party | Candidate | Votes | % | |
|---|---|---|---|---|
| Republican | Charles S. Gubser (Incumbent) | 139,850 | 64.6 | |
| Democratic | B. Frank Gillette | 76,597 | 35.4 | |
| Total votes | 216,447 | 100.0 | ||
| Turnout | ||||
| Republican hold | ||||
1974
| Party | Candidate | Votes | % | |||
|---|---|---|---|---|---|---|
| Democratic | Don Edwards (Incumbent) | 86,014 | 77 | |||
| Republican | Herb Smith | 25,678 | 23 | |||
| Total votes | 111,692 | 100 | ||||
| Turnout | ||||||
| Democratic gain from Republican | ||||||
1976
| Party | Candidate | Votes | % | |
|---|---|---|---|---|
| Democratic | Don Edwards (Incumbent) | 111,992 | 72.0 | |
| Republican | Herb Smith | 38,088 | 24.5 | |
| American Independent | Edmon V. Kaiser | 5,363 | 3.5 | |
| Total votes | 155,443 | 100.0 | ||
| Turnout | ||||
| Democratic hold | ||||
1978
| Party | Candidate | Votes | % | |
|---|---|---|---|---|
| Democratic | Don Edwards (Incumbent) | 84,488 | 67.1 | |
| Republican | Rudy Hansen | 41,374 | 32.9 | |
| Total votes | 125,862 | 100.0 | ||
| Turnout | ||||
| Democratic hold | ||||
1980
| Party | Candidate | Votes | % | |
|---|---|---|---|---|
| Democratic | Don Edwards (Incumbent) | 102,231 | 62.1 | |
| Republican | Joseph M. Lutton | 45,987 | 27.9 | |
| Libertarian | Joseph Fuhrig | 11,904 | 7.2 | |
| American Independent | Edmon V. Kaiser | 4,421 | 2.7 | |
| Total votes | 164,543 | 100.0 | ||
| Turnout | ||||
| Democratic hold | ||||
1982
| Party | Candidate | Votes | % | |
|---|---|---|---|---|
| Democratic | Don Edwards (Incumbent) | 77,263 | 62.7 | |
| Republican | Bob Herriott | 41,506 | 33.7 | |
| Libertarian | Dale Burrow | 2,403 | 1.9 | |
| American Independent | Edmon V. Kaiser | 2,109 | 1.7 | |
| Total votes | 123,281 | 100.0 | ||
| Turnout | ||||
| Democratic hold | ||||
1984
| Party | Candidate | Votes | % | |
|---|---|---|---|---|
| Democratic | Don Edwards (Incumbent) | 102,469 | 62.4 | |
| Republican | Bob Herriott | 56,256 | 34.3 | |
| Libertarian | Perr Cardestam | 2,789 | 1.7 | |
| American Independent | Edmon V. Kaiser | 2,663 | 1.6 | |
| Total votes | 164,177 | 100.0 | ||
| Turnout | ||||
| Democratic hold | ||||
1986
| Party | Candidate | Votes | % | |
|---|---|---|---|---|
| Democratic | Don Edwards (Incumbent) | 84,240 | 70.5 | |
| Republican | Michael R. La Crone | 31,826 | 26.6 | |
| Libertarian | Perr Cardestam | 1,797 | 1.5 | |
| Peace and Freedom | Bradley L. Mayer | 1,701 | 1.4 | |
| Total votes | 119,564 | 100.0 | ||
| Turnout | ||||
| Democratic hold | ||||
1988
| Party | Candidate | Votes | % | |
|---|---|---|---|---|
| Democratic | Don Edwards (Incumbent) | 142,500 | 86.2 | |
| Libertarian | Kennita Watson | 22,801 | 13.8 | |
| Total votes | 165,301 | 100.0 | ||
| Turnout | ||||
| Democratic hold | ||||
1990
| Party | Candidate | Votes | % | |
|---|---|---|---|---|
| Democratic | Don Edwards (Incumbent) | 81,875 | 62.7 | |
| Republican | Mark Patrosso | 48,747 | 37.3 | |
| No party | James (write-in) | 15 | 0.0 | |
| Total votes | 130,637 | 100.0 | ||
| Turnout | ||||
| Democratic hold | ||||
1992
| Party | Candidate | Votes | % | ||
|---|---|---|---|---|---|
| Republican | Bill Baker | 145,702 | 52 | ||
| Democratic | Wendell H. Williams | 134,635 | 48 | ||
| No party | Williams (write-in) | 55 | 0 | ||
| No party | Janloia (write-in) | 37 | 0 | ||
| Total votes | 280,429 | 100 | |||
| Turnout | |||||
| Republican win (new seat) | |||||
1994
| Party | Candidate | Votes | % | |
|---|---|---|---|---|
| Republican | Bill Baker (Incumbent) | 138,916 | 59.30 | |
| Democratic | Ellen Schwartz | 90,523 | 38.65 | |
| Peace and Freedom | Craig W. Cooper | 4,802 | 2.05 | |
| Total votes | 234,241 | 100.0 | ||
| Turnout | ||||
| Republican hold | ||||
1996
| Party | Candidate | Votes | % | |||
|---|---|---|---|---|---|---|
| Democratic | Ellen Tauscher | 137,726 | 48.7 | |||
| Republican | Bill Baker (Incumbent) | 133,633 | 47.2 | |||
| Reform | John Place | 6,354 | 2.3 | |||
| Natural Law | Valerie Janlois | 3,047 | 1.0 | |||
| Libertarian | Gregory Lyon | 2,423 | 0.8 | |||
| Total votes | 283,183 | 100.0 | ||||
| Turnout | ||||||
| Democratic gain from Republican | ||||||
1998
| Party | Candidate | Votes | % | |
|---|---|---|---|---|
| Democratic | Ellen Tauscher (Incumbent) | 127,134 | 53.46 | |
| Republican | Charles Ball | 103,299 | 43.44 | |
| Natural Law | Valerie Janlois | 3,941 | 1.66 | |
| Reform | John Place | 3,435 | 1.44 | |
| Total votes | 237,809 | 100.0 | ||
| Turnout | ||||
| Democratic hold | ||||
2000
| Party | Candidate | Votes | % | |
|---|---|---|---|---|
| Democratic | Ellen Tauscher (Incumbent) | 160,429 | 52.7 | |
| Republican | Claude B. Hutchison Jr. | 134,863 | 44.2 | |
| Natural Law | Valerie Janlois | 9,527 | 3.1 | |
| Total votes | 304,819 | 100.0 | ||
| Turnout | ||||
| Democratic hold | ||||
2002
| Party | Candidate | Votes | % | |
|---|---|---|---|---|
| Democratic | Ellen Tauscher (Incumbent) | 123,481 | 75.6 | |
| Libertarian | Sonia E. Alonso Harden | 39,858 | 24.4 | |
| Total votes | 163,339 | 100.0 | ||
| Turnout | ||||
| Democratic hold | ||||
2004
| Party | Candidate | Votes | % | |
|---|---|---|---|---|
| Democratic | Ellen Tauscher (Incumbent) | 182,750 | 65.8 | |
| Republican | Jeff Ketelson | 95,349 | 34.2 | |
| Total votes | 278,099 | 100.0 | ||
| Turnout | ||||
| Democratic hold | ||||
2006
| Party | Candidate | Votes | % | |
|---|---|---|---|---|
| Democratic | Ellen Tauscher (Incumbent) | 130,859 | 66.5 | |
| Republican | Darcy Linn | 66,069 | 33.5 | |
| Republican | Jeff Ketelson (write-in) | 50 | 0.0 | |
| Total votes | 196,978 | 100.0 | ||
| Turnout | ||||
| Democratic hold | ||||
2008
| Party | Candidate | Votes | % | |
|---|---|---|---|---|
| Democratic | Ellen Tauscher (Incumbent) | 192,226 | 65.2 | |
| Republican | Nicholas Gerber | 91,877 | 31.1 | |
| Peace and Freedom | Eugene E. Ruyle | 11,062 | 3.7 | |
| Total votes | 295,165 | 100.0 | ||
| Turnout | ||||
| Democratic hold | ||||
2009 (Special)
| Party | Candidate | Votes | % | |
|---|---|---|---|---|
| Democratic | John Garamendi | 72,817 | 52.85 | |
| Republican | David Harmer | 59,017 | 42.83 | |
| Green | Jeremy Cloward | 2,515 | 1.83 | |
| Peace and Freedom | Mary McIlroy | 1,846 | 1.34 | |
| American Independent | Jerome Denham | 1,591 | 1.15 | |
| Total votes | 137,786 | 100.00 | ||
| Turnout | 35.33 | |||
| Democratic hold | ||||
2010
| Party | Candidate | Votes | % | |
|---|---|---|---|---|
| Democratic | John Garamendi (Incumbent) | 137,578 | 58.9 | |
| Republican | Gary Clift | 88,512 | 37.8 | |
| Green | Jeremy Cloward | 7,716 | 3.3 | |
| Total votes | 233,806 | 100.0 | ||
| Turnout | ||||
| Democratic hold | ||||
2012
| Party | Candidate | Votes | % | |
|---|---|---|---|---|
| Republican | Jeff Denham | 110,265 | 52.7 | |
| Democratic | José M. Hernández | 98,934 | 47.3 | |
| Total votes | 209,199 | 100.0 | ||
| Turnout | ||||
| Republican hold | ||||
2014
| Party | Candidate | Votes | % | |
|---|---|---|---|---|
| Republican | Jeff Denham (Incumbent) | 70,582 | 56% | |
| Democratic | Michael Eggman | 55,123 | 44% | |
| Total votes | 125,705 | 100.0% | ||
| Turnout | ||||
| Republican hold | ||||
2016
| Party | Candidate | Votes | % | |
|---|---|---|---|---|
| Republican | Jeff Denham (Incumbent) | 124,671 | 51.7 | |
| Democratic | Michael Eggman | 116,470 | 48.3 | |
| Total votes | 241,141 | 100.0 | ||
| Republican hold | ||||
2018
| Primary election | ||||
|---|---|---|---|---|
| Party | Candidate | Votes | % | |
| Republican | Jeff Denham (Incumbent) | 45,719 | 37.5 | |
| Democratic | Josh Harder | 20,742 | 17.0 | |
| Republican | Ted D. Howze | 17,723 | 14.6 | |
| Democratic | Michael Eggman | 12,446 | 10.2 | |
| Democratic | Virginia Madueño | 11,178 | 9.2 | |
| Democratic | Sue Zwahlen | 9,945 | 8.2 | |
| Democratic | Michael J. "Mike" Barkley | 2,904 | 2.4 | |
| Democratic | Dotty Nygard (withdrawn) | 1,100 | 0.9 | |
| Total votes | 121,757 | 100.0 | ||
| General election | ||||
| Democratic | Josh Harder | 115,945 | 52.3 | |
| Republican | Jeff Denham (Incumbent) | 105,955 | 47.7 | |
| Total votes | 221,900 | 100.0 | ||
| Democratic gain from Republican | ||||
2020
| Party | Candidate | Votes | % | |
|---|---|---|---|---|
| Democratic | Josh Harder (Incumbent) | 166,865 | 55.2 | |
| Republican | Ted Howze | 135,629 | 44.8 | |
| Total votes | 302,494 | 100.0 | ||
| Democratic hold | ||||
References
- Center for New Media & Promotion (CNMP), US Census Bureau. "My Congressional District". www.census.gov.
- "Citizens Redistricting Commission Final Report, 2011" (PDF).
- "Partisan Voting Index – Districts of the 115th Congress" (PDF). The Cook Political Report. April 7, 2017. Retrieved April 7, 2017.
- "Maps: Final Congressional Districts". Citizens Redistricting Commission. Archived from the original on March 10, 2013. Retrieved February 24, 2013.
- "Ellen Tauscher is the Grand Dame of CD-10". May 18, 2015. Archived from the original on May 18, 2015.
- See Politics of California#Bi-partisan gerrymandering
- "Tauscher accepts State Department post". March 18, 2009.
- "Archived copy". Archived from the original on April 10, 2009. Retrieved June 14, 2009.CS1 maint: archived copy as title (link)
- Stannard, Matthew (June 25, 2009). "Rep. Tauscher new U.S. arms control chief". San Francisco Chronicle. Retrieved June 25, 2009.
- https://elections.cdn.sos.ca.gov/sov/1994-general/ssov/governor-congress-district.pdf
- https://elections.cdn.sos.ca.gov/sov/1994-general/ssov/us-senate-congress-district.pdf
- https://elections.cdn.sos.ca.gov/sov/1996-general/ssov/president-congress-district.pdf
- (PDF). September 29, 2011 https://web.archive.org/web/20110929224728/http://www.sos.ca.gov/elections/sov/1998-general/ssov/gov-cd.pdf#. Archived from the original (PDF) on September 29, 2011. Missing or empty
|title=(help) - (PDF). September 29, 2011 https://web.archive.org/web/20110929224732/http://www.sos.ca.gov/elections/sov/1998-general/ssov/sen-cd.pdf#. Archived from the original (PDF) on September 29, 2011. Missing or empty
|title=(help) - "Statement of Vote (2000 President)" (PDF). Archived from the original (PDF) on June 11, 2007.
- "Statement of Vote (2000 Senator)" (PDF). Archived from the original (PDF) on June 11, 2007.
- "Statement of Vote (2002 Governor)" (PDF). Archived from the original (PDF) on November 11, 2010.
- "Statement of Vote (2003 Recall Question)" (PDF). Archived from the original (PDF) on May 20, 2011.
- "Statement of Vote (2003 Governor)" (PDF). Archived from the original (PDF) on May 20, 2011.
- "Statement of Vote (2004 President)" (PDF). Archived from the original (PDF) on August 1, 2010.
- "Statement of Vote (2004 Senator)" (PDF). Archived from the original (PDF) on August 10, 2011.
- "Statement of Vote (2006 Governor)" (PDF). Archived from the original (PDF) on August 10, 2011.
- "Statement of Vote (2006 Senator)" (PDF). Archived from the original (PDF) on August 10, 2011.
- "(2008 President)". Archived from the original on February 11, 2009.
- Supplement to the Statement of Vote - Counties by Congressional Districts for United States Senator
- Supplement to the Statement of Vote - Counties by Congressional Districts for Governor
- Supplement to the Statement of Vote - Counties by Congressional Districts for United States Senator
- J. Miles Coleman. "California's 2018 statewide races by congressional district". twitter.com. Retrieved January 6, 2018.
- Supplement to the Statement of Vote - Counties by Congressional Districts for United States Senator
- California Secretary of State. Registration by US Congressional District, Report of Registration-May 21, 2018. https://www.sos.ca.gov/elections/report-registration/15day-primary-2018/
- "JoinCalifornia - 11-07-1916 Election". www.joincalifornia.com.
- "1920 election results" (PDF).
- "1922 election results" (PDF).
- "JoinCalifornia - 05-01-1923 Election". www.joincalifornia.com.
- "1924 election results" (PDF).
- "1926 election results" (PDF).
- "1928 election results" (PDF).
- "1930 election results" (PDF).
- "1932 election results" (PDF).
- "1934 election results" (PDF).
- "1936 election results" (PDF).
- "JoinCalifornia - 05-04-1937 Election". www.joincalifornia.com.
- "1938 election results" (PDF).
- "1940 election results" (PDF).
- "1942 election results" (PDF).
- "1944 election results" (PDF).
- "1946 election results" (PDF).
- "1948 election results" (PDF).
- "1950 election results" (PDF).
- "1952 election results" (PDF).
- "1954 election results" (PDF).
- "1956 election results" (PDF).
- "1958 election results" (PDF).
- "1960 election results" (PDF).
- "1962 election results" (PDF).
- "1964 election results" (PDF).
- "1966 election results" (PDF).
- "1968 election results" (PDF).
- "1970 election results" (PDF).
- "1972 election results" (PDF).
- "1974 election results" (PDF).
- "1976 election results" (PDF).
- "1978 election results" (PDF).
- "1980 election results" (PDF).
- "1982 election results" (PDF).
- "1984 election results" (PDF).
- "1986 election results" (PDF).
- "1988 election results" (PDF).
- "1990 election results" (PDF).
- "1992 election results" (PDF).
- "1994 election results" (PDF).
- "1996 election results" (PDF).
- "1998 election results" (PDF).
- "2000 election results" (PDF).
- "2002 general election results" (PDF). Archived from the original (PDF) on February 3, 2009.
- "2004 general election results" (PDF).
- "2006 general election results" (PDF). Archived from the original (PDF) on November 27, 2008.
- "2008 general election results" (PDF). Archived from the original (PDF) on December 21, 2008.
- "Official Canvass: United States Representative 10th Congressional District Special General Election, November 3, 2009" (PDF). Secretary of State of California. November 16, 2009. Archived from the original (PDF) on November 19, 2009. Retrieved November 16, 2009.
- "2010 general election results" (PDF). Archived from the original (PDF) on May 20, 2011.
- "2012 general election results" (PDF). Archived from the original (PDF) on October 19, 2013.
- "Election 2020 | California Secretary of State". www.sos.ca.gov.
External links
- GovTrack.us: California's 10th congressional district
- RAND California Election Returns: District Definitions (out of date)
- California Voter Foundation map - CD10 (out of date)