2016 United States presidential election in California
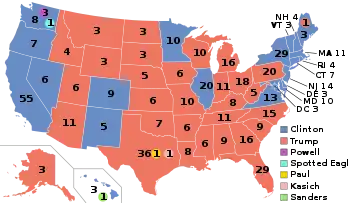
The 2016 United States presidential election in California was held on Tuesday, November 8, 2016, as part of the 2016 United States presidential election in which all 50 states plus the District of Columbia participated. California voters chose electors to represent them in the Electoral College via a popular vote, pitting the Republican Party's nominee, businessman Donald Trump, and running mate Indiana Governor Mike Pence against Democratic Party nominee, former Secretary of State Hillary Clinton, and her running mate Virginia Senator Tim Kaine. California has 55 electoral votes in the Electoral College, the most of any state.[2]
| ||||||||||||||||||||||||||
| Turnout | 75.27% (of registered voters) 58.74% (of eligible voters) | |||||||||||||||||||||||||
|---|---|---|---|---|---|---|---|---|---|---|---|---|---|---|---|---|---|---|---|---|---|---|---|---|---|---|
| ||||||||||||||||||||||||||
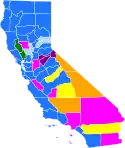
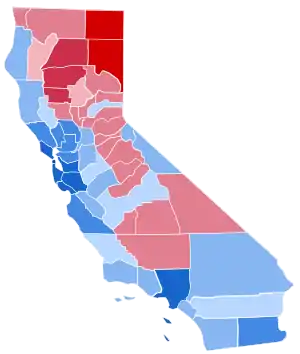 County Results
| ||||||||||||||||||||||||||
| ||||||||||||||||||||||||||
.jpg.webp)
| Elections in California |
|---|
 |
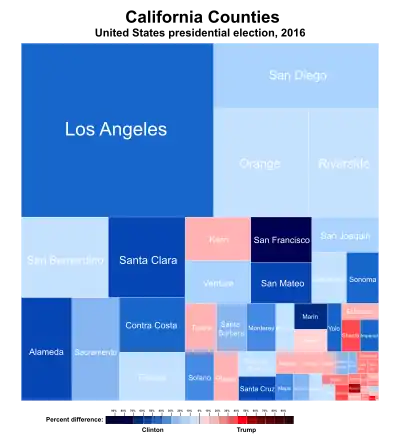
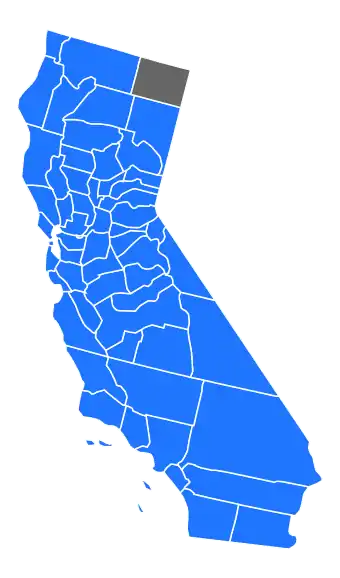
Clinton won the state with 61.73 percent of the vote and a 30.11 percent margin. This was also the first time that Orange County voted Democratic since 1936, when Franklin D. Roosevelt swept every single county in the state. Trump's 31.62% vote share in the state was the lowest for a major-party candidate since John W. Davis's 8.2% in 1924. However, Trump became the first Republican to win the White House without carrying Riverside County since the county's founding in 1893, the first to do so without carrying San Diego County since William McKinley in 1896, the first to do so without carrying San Bernardino County since Ulysses S. Grant in 1868, the first to do so without carrying Orange County since the county's founding in 1889, and the first to do so without carrying Ventura County since the county's founding in 1872.
General election
Statewide results
| 2016 U.S. presidential election in California[3] | |||||||
|---|---|---|---|---|---|---|---|
| Party | Presidential candidate | Popular vote | Electoral vote | ||||
| Count | Percentage | ||||||
| Democratic | Hillary Clinton | 8,753,788 | 61.73% | 55 | |||
| Republican/American Independent | Donald Trump | 4,483,810 | 31.62% | 0 | |||
| Libertarian | Gary Johnson | 478,500 | 3.37% | 0 | |||
| Green | Jill Stein | 278,657 | 1.97% | 0 | |||
| Independent | Bernie Sanders (write-in) | 79,341 | 0.56% | 0 | |||
| Peace and Freedom | Gloria La Riva | 66,101 | 0.47% | 0 | |||
| Independent | Evan McMullin (write-in) | 39,596 | 0.28% | 0 | |||
| Solidarity | Mike Maturen (write-in) | 1,316 | 0.01% | 0 | |||
| Independent | Laurence Kotlikoff (write-in) | 402 | 0.00% | 0 | |||
| Independent | Jerry White (write-in) | 84 | 0.00% | 0 | |||
| Date | November 8, 2016 | Total voters | Registered: 19,411,771 Eligible: 24,875,293 | ||||
| Turnout % | Registered: 75.27% VAP: 58.74% |
Turnout votes | Valid votes: 14,181,585 Invalid votes: 428,924 | ||||
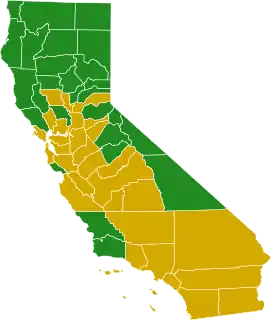
Primary elections
On June 7, 2016, in the presidential primaries, California voters expressed their preferences for the Democratic, Republican, Green, and Libertarian, Peace and Freedom, and American Independent parties' respective nominees for president.
While California has had a top-two candidates open primary system since 2011,[4] presidential primaries are still partisan races. Registered members of each party may only vote in their party's presidential primary. Unaffiliated voters may choose any one primary in which to vote, if the party allows such voters to participate.[4] For 2016, the American Independent, Democratic, and Libertarian parties have chosen to allow voters registered with no party preference to request their respective party's presidential ballots.[5]
Democratic primary
Seven candidates appeared on the Democratic presidential primary ballot:[6]
Opinion polling
Results
| Candidate | Popular vote | Estimated delegates | |||
|---|---|---|---|---|---|
| Count | Percentage | Pledged | Unpledged | Total | |
| Hillary Clinton | 2,745,302 | 53.07% | 254 | 66 | 320 |
| Bernie Sanders | 2,381,722 | 46.04% | 221 | 0 | 221 |
| Willie Wilson | 12,014 | 0.23% | |||
| Michael Steinberg | 10,880 | 0.21% | |||
| Rocky De La Fuente | 8,453 | 0.16% | |||
| Henry Hewes | 7,743 | 0.15% | |||
| Keith Judd | 7,201 | 0.14% | |||
| Write-in | 23 | 0.00% | |||
| Uncommitted | N/A | 10 | 10 | ||
| Total | 5,173,338 | 100% | 475 | 76 | 551 |
| Source: California Secretary of State - Presidential Primary Election Statement of Votes The Green Papers | |||||
Republican primary
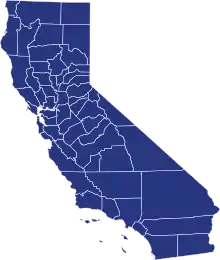
Five candidates appeared on the Republican presidential primary ballot, four of whom had suspended their campaigns prior to the primary:[6]
- Donald Trump
- Ben Carson (withdrawn)
- Ted Cruz (withdrawn)
- John Kasich (withdrawn)
- Jim Gilmore (withdrawn)
Donald Trump, the only candidate with an active campaign, won each Congressional district by substantial margins, as well as all the statewide delegates, to capture all 172 votes.
| California Republican primary, June 7, 2016 | |||||
|---|---|---|---|---|---|
| Candidate | Votes | Percentage | Actual delegate count | ||
| Bound | Unbound | Total | |||
| Donald Trump | 1,665,135 | 74.76% | 172 | 0 | 172 |
| John Kasich (withdrawn) | 252,544 | 11.34% | 0 | 0 | 0 |
| Ted Cruz (withdrawn) | 211,576 | 9.50% | 0 | 0 | 0 |
| Ben Carson (withdrawn) | 82,259 | 3.69% | 0 | 0 | 0 |
| Jim Gilmore (withdrawn) | 15,691 | 0.70% | 0 | 0 | 0 |
| Write-ins | 101 | 0.00% | 0 | 0 | 0 |
| Unprojected delegates: | 0 | 0 | 0 | ||
| Total: | 2,227,306 | 100.00% | 172 | 0 | 172 |
| Source: The Green Papers | |||||
Libertarian primary
Twelve candidates appeared on the Libertarian presidential primary ballot:
- Marc Feldman
- John Hale
- Cecil Ince
- Gary Johnson
- Steve Kerbel
- John McAfee
- Darryl Perry
- Austin Petersen
- Derrick M. Reid
- Jack Robinson Jr.
- Rhett Smith
- Joy Waymire
The primary took place after Gary Johnson won the Libertarian nomination at the Party's 2016 convention.
| California Libertarian presidential primary, June 7, 2016[7] | ||
|---|---|---|
| Candidate | Votes | Percentage |
| Gary Johnson | 19,294 | 62% |
| John McAfee | 3,139 | 10% |
| Austin Petersen | 1,853 | 6% |
| Rhett Smith | 1,531 | 5% |
| Joy Waymire | 923 | 3% |
| John David Hale | 873 | 3% |
| Marc Allan Feldman | 867 | 3% |
| Jack Robinson Jr. | 739 | 2% |
| Steve Kerbel | 556 | 2% |
| Darryl Perry | 521 | 2% |
| Derrick Michael Reid | 462 | 1% |
| Cecil Ince | 417 | 1% |
| Total | 31,175 | 100% |
Green primary
| Green Party of California presidential primary, June 7, 2016[8] | |||
|---|---|---|---|
| Candidate | Votes | Percentage | National delegates |
| Jill Stein | 10,134 | 76.4% | 40 |
| Darryl Cherney | 1,288 | 9.7% | 5 |
| Sedinam Kinamo Christin Moyowasifza Curry | 762 | 5.7% | 3 |
| William Kreml | 555 | 4.2% | 2 |
| Kent Mesplay | 528 | 4.0% | 2 |
| Total | 13,267 | 100% | 50 |
American Independent
| California American Independent presidential primary, June 7, 2016[9] | ||
|---|---|---|
| Candidate | Votes | Percentage |
| Alan Spears | 7,348 | 19% |
| Arthur Harris | 6,510 | 17% |
| Robert Ornelas | 6,411 | 17% |
| J. R. Myers | 4,898 | 13% |
| Wiley Drake | 4,828 | 13% |
| James Hedges | 3,989 | 11% |
| Thomas Hoefling | 3,917 | 10% |
| Total | 37,901 | 100% |
The American Independent Party, a far-right and paleoconservative political party that formed when endorsing the candidacy of George Wallace in 1968 held a small presidential primary on June 7. It was won by attorney Alan Spears.
The American Independent Party nullified the results of this primary when they endorsed Donald Trump in August.[10] The party indicated that Trump was a popular write-in choice during the primary, but was not allowed on the ballot because there was no evidence that Trump wanted the American Independent endorsement.[11]
Peace and Freedom
| California Peace and Freedom presidential primary, June 7, 2016[12] | ||
|---|---|---|
| Candidate | Votes | Percentage |
| Gloria Estela La Riva | 2,232 | 49% |
| Monica Moorehead | 1,369 | 30% |
| Lynn Sandra Kahn | 963 | 21% |
| Total | 4,564 | 100% |
Polling
Results
Below is an official list of California's Recognized Write-in Candidates.
- Laurence Kotlikoff for president and Edward Leamer for vice president
- Mike Maturen for president and Juan Muñoz for vice president
- Evan McMullin for president and Nathan Johnson for vice president
- Bernie Sanders for president and Tulsi Gabbard for vice president
- Jerry White for president and Niles Niemuth for vice president
California law only requires that 55 electors sign on to declare a person a write-in candidate, not that the persons consent, according to a statement from the Secretary of State's Office.[13]
Results by county
Final results by county certified December 16, 2016.[14]
| County | Clinton | Clinton% | Trump | Trump% | Johnson | Johnson% | Stein | Stein% | Sanders | La Riva | McMullin | Maturen | Kotlikoff | White | Margin | Margin% | Total |
|---|---|---|---|---|---|---|---|---|---|---|---|---|---|---|---|---|---|
| Alameda | 514,842 | 78.7% | 95,922 | 14.7% | 16,906 | 2.6% | 17,830 | 2.7% | 4,206 | 3,162 | 1,291 | 71 | 27 | 9 | 418,920 | 64.0% | 654,266 |
| Alpine | 334 | 55.5% | 217 | 36.0% | 25 | 4.2% | 21 | 3.5% | 1 | 3 | 1 | 0 | 0 | 0 | 117 | 19.4% | 602 |
| Amador | 6,004 | 33.9% | 10,485 | 59.1% | 804 | 4.5% | 227 | 1.3% | 100 | 55 | 59 | 0 | 0 | 0 | -4,481 | -25.3% | 17,734 |
| Butte | 41,567 | 43.5% | 45,144 | 47.2% | 4,625 | 4.8% | 2,594 | 2.7% | 782 | 501 | 340 | 10 | 0 | 1 | -3,577 | -3.7% | 95,564 |
| Calaveras | 7,944 | 34.3% | 13,511 | 58.4% | 1,104 | 4.8% | 424 | 1.8% | 75 | 56 | 22 | 0 | 0 | 0 | -5,567 | -24.1% | 23,136 |
| Colusa | 2,661 | 40.1% | 3,551 | 53.5% | 260 | 3.9% | 85 | 1.3% | 24 | 39 | 12 | 0 | 0 | 0 | -890 | -13.4% | 6,632 |
| Contra Costa | 319,287 | 68.5% | 115,956 | 24.9% | 16,123 | 3.5% | 8,637 | 1.9% | 3,204 | 1,566 | 1,355 | 36 | 11 | 0 | 203,331 | 43.6% | 466,175 |
| Del Norte | 3,485 | 36.5% | 5,134 | 53.7% | 416 | 4.4% | 245 | 2.6% | 139 | 81 | 58 | 0 | 0 | 0 | -1,649 | -17.3% | 9,558 |
| El Dorado | 36,404 | 38.9% | 49,247 | 52.6% | 5,027 | 5.4% | 1,425 | 1.5% | 713 | 190 | 578 | 4 | 3 | 0 | -12,843 | -13.7% | 93,591 |
| Fresno | 141,341 | 50.1% | 124,049 | 43.9% | 9,246 | 3.3% | 4,300 | 1.5% | 1,417 | 875 | 1,070 | 17 | 3 | 1 | 17,292 | 6.1% | 282,319 |
| Glenn | 3,065 | 32.4% | 5,788 | 61.1% | 375 | 4.0% | 97 | 1.0% | 58 | 54 | 31 | 2 | 0 | 0 | -2,723 | -28.8% | 9,470 |
| Humboldt | 33,200 | 56.0% | 18,373 | 31.0% | 2,163 | 3.7% | 3,681 | 6.2% | 1,264 | 379 | 181 | 5 | 0 | 0 | 14,827 | 25.0% | 59,246 |
| Imperial | 32,667 | 67.9% | 12,704 | 26.4% | 1,221 | 2.5% | 745 | 1.5% | 291 | 339 | 81 | 43 | 0 | 0 | 19,963 | 41.5% | 48,091 |
| Inyo | 3,155 | 39.0% | 4,248 | 52.5% | 328 | 4.1% | 214 | 2.6% | 66 | 51 | 24 | 0 | 0 | 0 | -1,093 | -13.5% | 8,086 |
| Kern | 98,689 | 40.4% | 129,584 | 53.1% | 9,359 | 3.8% | 2,887 | 1.2% | 1,199 | 1,522 | 891 | 27 | 3 | 2 | -30,895 | -12.7% | 244,163 |
| Kings | 13,617 | 40.2% | 18,093 | 53.3% | 1,338 | 3.9% | 411 | 1.2% | 115 | 251 | 90 | 0 | 0 | 0 | -4,476 | -13.2% | 33,915 |
| Lake | 11,496 | 46.9% | 10,599 | 43.3% | 1,095 | 4.5% | 930 | 3.8% | 219 | 103 | 53 | 1 | 0 | 0 | 897 | 3.7% | 24,496 |
| Lassen | 2,224 | 21.1% | 7,574 | 72.0% | 473 | 4.5% | 105 | 1.0% | 52 | 46 | 47 | 1 | 2 | 0 | -5,350 | -50.8% | 10,524 |
| Los Angeles | 2,464,364 | 71.8% | 769,743 | 22.4% | 88,968 | 2.6% | 76,465 | 2.2% | 7,724 | 21,993 | 4,607 | 274 | 155 | 15 | 1,694,621 | 49.3% | 3,434,308 |
| Madera | 17,029 | 39.5% | 23,357 | 54.2% | 1,558 | 3.6% | 644 | 1.5% | 183 | 187 | 145 | 9 | 0 | 0 | -6,328 | -14.7% | 43,112 |
| Marin | 108,707 | 78.1% | 21,771 | 15.6% | 4,180 | 3.0% | 3,109 | 2.2% | 896 | 351 | 249 | 4 | 6 | 0 | 86,936 | 62.4% | 139,273 |
| Mariposa | 3,122 | 35.2% | 5,185 | 58.4% | 326 | 3.7% | 189 | 2.1% | 0 | 55 | 0 | 0 | 0 | 0 | -2,063 | -23.2% | 8,877 |
| Mendocino | 22,079 | 58.9% | 10,888 | 29.1% | 1,331 | 3.6% | 2,108 | 5.6% | 789 | 151 | 124 | 4 | 3 | 0 | 11,191 | 29.9% | 37,477 |
| Merced | 37,317 | 52.7% | 28,725 | 40.6% | 2,410 | 3.4% | 1,209 | 1.7% | 506 | 454 | 162 | 6 | 0 | 0 | 8,592 | 12.1% | 70,789 |
| Modoc | 877 | 23.2% | 2,696 | 71.2% | 122 | 3.2% | 50 | 1.3% | 19 | 13 | 11 | 0 | 0 | 0 | -1819 | -48.0% | 3,788 |
| Mono | 2,773 | 52.6% | 2,111 | 40.0% | 222 | 4.2% | 142 | 2.7% | 2 | 23 | 3 | 0 | 0 | 0 | 662 | 12.5% | 5,276 |
| Monterey | 89,088 | 66.8% | 34,895 | 26.2% | 4,547 | 3.4% | 2,823 | 2.1% | 1,025 | 661 | 358 | 8 | 2 | 1 | 54,193 | 40.6% | 133,408 |
| Napa | 39,199 | 63.9% | 17,411 | 28.4% | 2,551 | 4.2% | 1,262 | 2.1% | 585 | 207 | 154 | 3 | 0 | 0 | 21,788 | 35.5% | 61,372 |
| Nevada | 26,053 | 47.4% | 23,365 | 42.5% | 2,378 | 4.3% | 2,189 | 4.0% | 685 | 85 | 179 | 0 | 0 | 1 | 2,688 | 4.9% | 54,935 |
| Orange | 609,961 | 50.9% | 507,148 | 42.3% | 46,128 | 3.9% | 18,068 | 1.5% | 6,239 | 4,898 | 4,917 | 131 | 27 | 4 | 102,813 | 8.6% | 1,197,521 |
| Placer | 73,509 | 40.2% | 95,138 | 52.0% | 9,245 | 5.1% | 2,501 | 1.4% | 1,132 | 238 | 1,032 | 33 | 10 | 1 | -21,629 | -11.8% | 182,839 |
| Plumas | 3,459 | 35.7% | 5,420 | 56.0% | 411 | 4.2% | 186 | 1.9% | 120 | 29 | 51 | 0 | 0 | 0 | -1,961 | -20.3% | 9,676 |
| Riverside | 373,695 | 49.7% | 333,243 | 44.4% | 24,089 | 3.2% | 11,320 | 1.5% | 3,387 | 3,433 | 2,168 | 49 | 4 | 3 | 40,452 | 5.4% | 751,391 |
| Sacramento | 326,023 | 58.3% | 189,789 | 33.9% | 24,412 | 4.4% | 9,846 | 1.8% | 4,429 | 2,556 | 2,205 | 65 | 5 | 0 | 136,234 | 24.4% | 559,330 |
| San Benito | 12,521 | 57.1% | 7,841 | 35.8% | 815 | 3.7% | 364 | 1.7% | 158 | 138 | 86 | 0 | 1 | 0 | 4,680 | 21.3% | 21,924 |
| San Bernardino | 340,833 | 52.1% | 271,240 | 41.5% | 21,050 | 3.2% | 10,604 | 1.6% | 4,551 | 3,786 | 1,877 | 37 | 5 | 0 | 69,593 | 10.6% | 653,983 |
| San Diego | 735,476 | 56.3% | 477,766 | 36.6% | 51,663 | 4.0% | 22,820 | 1.7% | 10,255 | 3,353 | 4,851 | 152 | 42 | 22 | 257,710 | 19.7% | 1,306,400 |
| San Francisco | 345,084 | 85.0% | 37,688 | 9.3% | 8,883 | 2.2% | 9,904 | 2.4% | 2,021 | 1,799 | 373 | 22 | 13 | 5 | 307,396 | 75.8% | 405,792 |
| San Joaquin | 121,124 | 54.0% | 88,936 | 39.7% | 8,049 | 3.6% | 3,134 | 1.4% | 1,372 | 903 | 617 | 26 | 5 | 0 | 32,188 | 14.4% | 224,166 |
| San Luis Obispo | 67,107 | 49.7% | 56,164 | 41.6% | 6,473 | 4.8% | 2,848 | 2.1% | 1,273 | 425 | 702 | 13 | 3 | 1 | 10,943 | 8.1% | 135,009 |
| San Mateo | 237,882 | 75.7% | 57,929 | 18.4% | 9,464 | 3.0% | 5,102 | 1.6% | 2,159 | 1,047 | 760 | 23 | 15 | 3 | 179,953 | 57.2% | 314,384 |
| Santa Barbara | 107,142 | 60.6% | 56,365 | 31.9% | 6,748 | 3.8% | 3,719 | 2.1% | 1,366 | 693 | 733 | 18 | 1 | 1 | 50,777 | 28.7% | 176,786 |
| Santa Clara | 511,684 | 72.7% | 144,826 | 20.6% | 25,325 | 3.6% | 12,664 | 1.8% | 4,066 | 2,759 | 2,296 | 61 | 25 | 3 | 366,858 | 52.1% | 703,709 |
| Santa Cruz | 95,249 | 73.9% | 22,438 | 17.4% | 4,325 | 3.4% | 4,485 | 3.5% | 1,395 | 627 | 283 | 10 | 4 | 5 | 72,811 | 56.5% | 128,821 |
| Shasta | 22,301 | 27.9% | 51,778 | 64.7% | 3,382 | 4.2% | 1,300 | 1.6% | 520 | 329 | 439 | 2 | 2 | 0 | -29,477 | -36.8% | 80,053 |
| Sierra | 601 | 32.8% | 1,048 | 57.3% | 98 | 5.4% | 42 | 2.3% | 20 | 15 | 6 | 0 | 0 | 0 | -447 | -24.4% | 1,830 |
| Siskiyou | 7,234 | 35.3% | 11,341 | 55.3% | 875 | 4.3% | 575 | 2.8% | 269 | 88 | 104 | 5 | 1 | 0 | -4,107 | -20.0% | 20,492 |
| Solano | 102,360 | 61.6% | 51,920 | 31.3% | 6,254 | 3.8% | 2,771 | 1.7% | 1,437 | 804 | 557 | 10 | 0 | 0 | 50,440 | 30.4% | 166,113 |
| Sonoma | 160,435 | 69.4% | 51,408 | 22.2% | 8,987 | 3.9% | 7,347 | 3.2% | 1,835 | 679 | 543 | 9 | 8 | 2 | 109,027 | 47.1% | 231,253 |
| Stanislaus | 81,647 | 47.4% | 78,494 | 45.6% | 6,662 | 3.9% | 2,562 | 1.5% | 1,184 | 986 | 563 | 46 | 2 | 0 | 3,153 | 1.8% | 172,146 |
| Sutter | 13,076 | 39.0% | 18,176 | 54.2% | 1,437 | 4.3% | 382 | 1.1% | 120 | 198 | 134 | 0 | 0 | 0 | -5,100 | -15.2% | 33,523 |
| Tehama | 6,809 | 28.5% | 15,494 | 64.8% | 953 | 4.0% | 290 | 1.2% | 139 | 138 | 82 | 3 | 0 | 0 | -8,685 | -36.3% | 23,908 |
| Trinity | 2,214 | 38.9% | 2,812 | 49.5% | 302 | 5.3% | 239 | 4.2% | 80 | 21 | 18 | 0 | 0 | 0 | -598 | -10.5% | 5,686 |
| Tulare | 47,585 | 42.4% | 58,299 | 51.9% | 3,800 | 3.4% | 1,620 | 1.4% | 226 | 636 | 163 | 5 | 0 | 0 | -10,714 | -9.5% | 112,334 |
| Tuolumne | 9,123 | 35.7% | 14,551 | 57.0% | 1,101 | 4.3% | 384 | 1.5% | 236 | 63 | 71 | 0 | 0 | 0 | -5,428 | -21.3% | 25,529 |
| Ventura | 194,402 | 55.3% | 132,323 | 37.6% | 13,679 | 3.9% | 6,315 | 1.8% | 2,031 | 1,481 | 1,422 | 60 | 9 | 4 | 62,079 | 17.6% | 351,726 |
| Yolo | 54,752 | 66.7% | 20,739 | 25.3% | 3,346 | 4.1% | 1,779 | 2.2% | 844 | 358 | 256 | 11 | 5 | 0 | 34,013 | 41.4% | 82,090 |
| Yuba | 7,910 | 34.4% | 13,170 | 57.3% | 1,063 | 4.6% | 438 | 1.9% | 138 | 168 | 111 | 0 | 0 | 0 | -5,260 | -22.9% | 22,998 |
| Total | 8,753,788 | 61.7% | 4,483,810 | 31.6% | 478,500 | 3.4% | 278,657 | 2.0% | 79,341 | 66,101 | 39,596 | 1,316 | 402 | 84 | 4,269,978 | 30.1% | 14,181,595 |
By congressional district
Clinton won 46 of the 53 congressional districts, including 7 held by Republicans.[15]
Outcome by city
Official outcomes by city.[16]
Counties that flipped from Republican to Democratic
Analysis
California has voted Democratic in every presidential election since Republican George H. W. Bush won the state in 1988. Hillary Clinton easily continued the Democratic tradition in California, winning the state with 61.7% of the vote, Clinton's second highest vote percentage of any state, behind Hawaii. Donald Trump received 31.6% of the vote, a Democratic victory margin of 30.11 points.[17] California was one of eleven states where Hillary Clinton outperformed outgoing President Barack Obama in 2012, and contributed to Clinton's national popular vote victory.[14] It was the largest state in which she did not lose counties Barack Obama won in 2012.
The California state result was historically one of the most successful for the Democratic Party nominee by several measures, as Hillary Clinton carried California by the largest margin of any Democratic candidate since Franklin D. Roosevelt swept the state by 35.25% in his 1936 re-election landslide.[18]
Clinton was also the first Democrat since FDR in 1936 to win traditionally Republican Orange County.[19]
Clinton received nearly 72% of the vote in Los Angeles County, making her the first Democratic presidential candidate in history to receive over 70% of the vote in Los Angeles County, the most heavily populated county in the United States.[20][21]
See also
References
- https://elections.cdn.sos.ca.gov/sov/2018-general/sov/04-historical-voter-reg-participation.pdf
- "Distribution of Electoral Votes". National Archives and Records Administration. Archived from the original on November 23, 2020. Retrieved November 23, 2020.
- http://elections.cdn.sos.ca.gov/sov/2016-general/sov/17-presidential-formatted.pdf
- "Frequently Asked Questions | California Secretary of State". Sos.ca.gov. Retrieved November 13, 2016.
- "County Clerk/Registrar of Voters (CC/ROV) Memorandum #16036" (PDF). Elections.cdn.sos.ca.gov. Retrieved November 13, 2016.
- "June 7, 2016, Presidential Primary Election | California Secretary of State". Sos.ca.gov. June 7, 2016. Archived from the original on March 6, 2016. Retrieved November 13, 2016.
- "Presidential Primary Election - Statement of Vote, June 7, 2016". Office of the Secretary of State of California. Government of California. Retrieved August 8, 2016.
- "President Green - Statewide Results | Primary Election | California Secretary of State". vote.sos.ca.gov. Retrieved June 19, 2016.
- "President American Independent - Statewide Results". Office of the Secretary of State of California. Government of California. June 8, 2016. Retrieved June 18, 2016.
- Myers, John. "Donald Trump will be the nominee of two parties on California's November ballot". Los Angeles Times. Retrieved November 27, 2016.
- Winger, Richard (July 8, 2016). "Donald Trump Probably Won American Independent Party Presidential Primary". Ballot Access News. Retrieved August 14, 2016.
- "President Peace and Freedom - Statewide Results". Office of the Secretary of State of California. Government of California. June 8, 2016. Archived from the original on November 9, 2012. Retrieved June 18, 2016.
- "California, your official presidential write-in options include Bernie Sanders and Evan McMullin". Los Angeles Times. October 28, 2016. Retrieved November 13, 2016.
- General Election - Statement of Vote, November 8, 2016. Final results certified by Alex Padilla, California Secretary of State. December 16, 2016.
- https://www.cookpolitical.com/introducing-2017-cook-political-report-partisan-voter-index
- "Supplement to Statement of Vote" (PDF). California Secretary of State. Retrieved November 25, 2020.
- "California Election Results 2016 – The New York Times". Retrieved November 10, 2016.
- "West Coast Trump". The New York Times. Retrieved November 13, 2016.
- Krishnakumar, Priya; Schleuss, Jon; Fox, Joe (November 11, 2016), "For the first time since Franklin D. Roosevelt, a majority in Orange County voted for a Democrat", Los Angeles Times
- "Presidential Election Results Los Angeles County". Los Angeles Almanac. Archived from the original on January 16, 2017. Retrieved January 14, 2017.
- "The 25 largest counties in the United States in 2016, by population (in millions)". Statista. Retrieved March 31, 2017.
External links
- RNC 2016 Republican Nominating Process
- Green papers for 2016 primaries, caucuses, and conventions
- California neighborhood election results — A Los Angeles Times map of election results down to the precinct level