California's 9th congressional district
California's 9th congressional district is a congressional district in the U.S. state of California.
| California's 9th congressional district | |||
|---|---|---|---|
.tif.png.webp) California's 9th congressional district - since January 3, 2013. | |||
| Representative |
| ||
| Population (2019) | 784,956 | ||
| Median household income | $72,237[1] | ||
| Ethnicity |
| ||
| Cook PVI | D+8[3] | ||
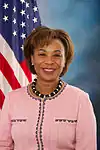
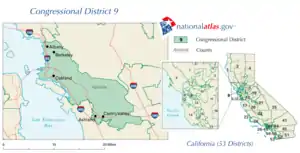
Jerry McNerney, a Democrat, has represented the district since January 2013. Currently, the 9th district is centered on Stockton. It consists of most of San Joaquin County and portions of Contra Costa and Sacramento counties. Cities in the district include Antioch, Galt, Oakley, Lathrop, Lodi, Mountain House, and Stockton.[4]
Prior to redistricting by the California Citizens Redistricting Commission of 2011, the 9th district encompassed part of the East Bay region of the San Francisco Bay Area. Cities in the district included Oakland, Berkeley and Castro Valley. Most of that area is now in the 13th district, while the current 9th is primarily made up of portions of the former 18th and 11th districts.
Competitiveness
John Kerry won the district in 2004 with 85.9% of the vote. Barack Obama swept the district in 2008 with 88.13% of the vote while John McCain received 9.87% of the vote, making it Obama's best and McCain's worst performance in California. The current 9th district is substantially more competitive, though it also favors the Democratic Party.
Election results from statewide races
| Year | Office | Results |
|---|---|---|
| 1992 | President | Clinton 78.7 - 12.4% |
| U.S. Senator | Boxer 80.5 - 14.5% | |
| U.S. Senator | Feinstein 82.9 - 13.0% | |
| 1994 | Governor | |
| U.S. Senator | ||
| 1996 | President | |
| 1998 | Governor | |
| U.S. Senator | ||
| 2000 | President[5] | Gore 78.6 - 12.0% |
| Senator[6] | Feinstein 73.1 - 12.2% | |
| 2002 | Governor[7] | Davis 67.5 - 12.8% |
| 2003 | Recall[8][9] | No 82.1 - 17.9% |
| Bustamante 66.2 - 14.7% | ||
| 2004 | President[10] | Kerry 85.9 - 12.6% |
| Senator[11] | Boxer 84.4 - 11.1% | |
| 2006 | Governor[12] | Angelides 67.3 - 24.0% |
| Senator[13] | Feinstein 81.4 - 8.3% | |
| 2008 | President[14] | Obama 88.1 - 9.9% |
| 2010 | Governor | Brown 85.1 - 11.4% |
| Senator | Boxer 84.8 - 11.7% | |
| 2012 | President | Obama 57.8 - 40.1% |
| Senator | Feinstein 59.6 - 40.4% | |
| 2014 | Governor[15] | Brown 55.1 - 44.9% |
| 2016 | President | Clinton 56.6 - 38.0% |
| Senator | Harris 59.0 - 41.0% | |
| 2018 | Governor | Newsom 53.9 - 46.1% |
| Senator | de Leon 51.2 - 48.8% | |
| 2020 | President | Biden 57.9 - 39.9% |
List of members representing the district

.jpg.webp)
.jpg.webp)
.jpg.webp)
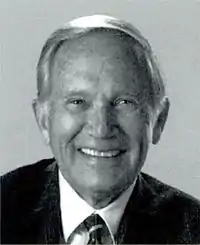

.jpg.webp)

.tif.png.webp)
Election results
|
1912 • 1914 • 1916 • 1918 • 1920 • 1921 (Special) • 1922 • 1924 • 1926 • 1928 • 1930 • 1932 • 1934 • 1936 • 1938 • 1940 • 1942 • 1944 • 1946 • 1948 • 1950 • 1952 • 1954 • 1956 • 1958 • 1960 • 1962 • 1964 • 1966 • 1968 • 1970 • 1972 • 1974 • 1976 • 1978 • 1980 • 1982 • 1984 • 1986 • 1988 • 1990 • 1992 • 1994 • 1996 • 1998 (Special) • 1998 • 2000 • 2002 • 2004 • 2006 • 2008 • 2010 • 2012 • 2014 • 2016 • 2018 • 2020 |
1912
| Party | Candidate | Votes | % | ||
|---|---|---|---|---|---|
| Republican | Charles W. Bell | 28,845 | 47.2 | ||
| Democratic | Thomas H. Kirk | 14,571 | 23.9 | ||
| Socialist | Ralph L. Criswell | 11,123 | 18.2 | ||
| Prohibition | George S. Yarnall | 6,510 | 10.7 | ||
| Total votes | 61,049 | 100.0 | |||
| Turnout | |||||
| Republican win (new seat) | |||||
1914
| Party | Candidate | Votes | % | |||
|---|---|---|---|---|---|---|
| Prohibition | Charles Hiram Randall | 28,097 | 30.9 | |||
| Progressive | Charles W. Bell (incumbent) | 27,560 | 30.3 | |||
| Republican | Frank C. Roberts | 25,176 | 27.7 | |||
| Socialist | Henry A. Hart | 10,084 | 11.1 | |||
| Total votes | 90,917 | 100.0 | ||||
| Turnout | ||||||
| Prohibition gain from Republican | ||||||
1916
| Party | Candidate | Votes | % | |
|---|---|---|---|---|
| Prohibition | Charles Hiram Randall (Incumbent) | 58,826 | 57.8 | |
| Independent | Charles W. Bell | 33,270 | 32.7 | |
| Socialist | Ralph L. Criswell | 9,661 | 9.5 | |
| Total votes | 101,757 | 100.0 | ||
| Turnout | ||||
| Prohibition hold | ||||
1918
| Party | Candidate | Votes | % | |
|---|---|---|---|---|
| Prohibition | Charles Hiram Randall (Incumbent) | 38,782 | 53.0 | |
| Republican | Montaville Flowers | 31,689 | 43.3 | |
| Socialist | Grace Silver Henry | 2,718 | 3.7 | |
| Total votes | 73,189 | 100.0 | ||
| Turnout | ||||
| Prohibition hold | ||||
1920
| Party | Candidate | Votes | % | |||
|---|---|---|---|---|---|---|
| Republican | Charles F. Van de Water | 62,952 | 59.7 | |||
| Prohibition | Charles Hiram Randall (Incumbent) | 36,675 | 34.8 | |||
| Socialist | Mary E. Garbutt | 5,819 | 5.5 | |||
| Total votes | 105,446 | 100.0 | ||||
| Turnout | ||||||
| Republican gain from Prohibition | ||||||
1921 (Special)
Republican Walter F. Lineberger won the special election to replace fellow Republican Charles F. Van de Water, who won the election but died before the 67th Congress convened. Data for this special election is not available.[17]
1922
| Party | Candidate | Votes | % | |
|---|---|---|---|---|
| Republican | Walter F. Lineberger (Incumbent) | 66,265 | 59.1 | |
| Prohibition | Charles Hiram Randall | 45,794 | 40.9 | |
| Total votes | 112,059 | 100.0 | ||
| Turnout | ||||
| Republican hold | ||||
1924
| Party | Candidate | Votes | % | |
|---|---|---|---|---|
| Republican | Walter F. Lineberger (Incumbent) | 119,993 | 63.9 | |
| Prohibition | Charles Hiram Randall | 67,735 | 36.1 | |
| Total votes | 187,728 | 100.0 | ||
| Turnout | ||||
| Republican hold | ||||
1926
| Party | Candidate | Votes | % | |
|---|---|---|---|---|
| Republican | William E. Evans (incumbent) | 102,270 | 59.5 | |
| Prohibition | Charles Hiram Randall | 61,719 | 35.9 | |
| Socialist | Charles F. Conley | 7,943 | 4.6 | |
| Total votes | 171,932 | 100.0 | ||
| Turnout | ||||
| Republican hold | ||||
1928
| Party | Candidate | Votes | % | |
|---|---|---|---|---|
| Republican | William E. Evans (incumbent) | 222,261 | 77.0 | |
| Democratic | James B. Ogg | 58,263 | 20.2 | |
| Socialist | Christian Sorenson | 8,090 | 2.8 | |
| Total votes | 288,614 | 100.0 | ||
| Turnout | ||||
| Republican hold | ||||
1930
| Party | Candidate | Votes | % | |
|---|---|---|---|---|
| Republican | William E. Evans (incumbent) | 182,176 | 100.0 | |
| Turnout | ||||
| Republican hold | ||||
1932
| Party | Candidate | Votes | % | |||
|---|---|---|---|---|---|---|
| Democratic | Denver S. Church | 50,125 | 61.6 | |||
| Republican | Henry E. Barbour (Incumbent) | 31,209 | 38.4 | |||
| Total votes | 81,334 | 100.0 | ||||
| Turnout | ||||||
| Democratic gain from Republican | ||||||
1934
| Party | Candidate | Votes | % | |||
|---|---|---|---|---|---|---|
| Republican | Bertrand W. Gearhart | 77,650 | 100.0 | |||
| Turnout | ||||||
| Republican gain from Democratic | ||||||
1936
| Party | Candidate | Votes | % | |
|---|---|---|---|---|
| Republican | Bertrand W. Gearhart (Incumbent) | 82,360 | 97 | |
| Communist | Carl B. Patterson | 2,571 | 3 | |
| Total votes | 84,931 | 100 | ||
| Turnout | ||||
| Republican hold | ||||
1938
| Party | Candidate | Votes | % | |
|---|---|---|---|---|
| Republican | Bertrand W. Gearhart (Incumbent) | 91,128 | 96.3 | |
| No party | George H. Sciaroni (write-in) | 3,536 | 3.7 | |
| Total votes | 94,664 | 100.0 | ||
| Turnout | ||||
| Republican hold | ||||
1940
| Party | Candidate | Votes | % | |
|---|---|---|---|---|
| Republican | Bertrand W. Gearhart (Incumbent) | 99,708 | 100.0 | |
| Turnout | ||||
| Republican hold | ||||
1942
| Party | Candidate | Votes | % | |
|---|---|---|---|---|
| Republican | Bertrand W. Gearhart (Incumbent) | 65,791 | 100.0 | |
| Turnout | ||||
| Republican hold | ||||
1944
| Party | Candidate | Votes | % | |
|---|---|---|---|---|
| Republican | Bertrand W. Gearhart (Incumbent) | 66,845 | 100.0 | |
| Turnout | ||||
| Republican hold | ||||
1946
| Party | Candidate | Votes | % | |
|---|---|---|---|---|
| Republican | Bertrand W. Gearhart (Incumbent) | 50,171 | 53.7 | |
| Democratic | Hubert Phillips | 43,244 | 46.3 | |
| Total votes | 93,415 | 100.0 | ||
| Turnout | ||||
| Republican hold | ||||
1948
| Party | Candidate | Votes | % | |||
|---|---|---|---|---|---|---|
| Democratic | Cecil F. White | 72,826 | 51.3 | |||
| Republican | Bertrand W. Gearhart (Incumbent) | 66,563 | 46.9 | |||
| Progressive | Josephine F. Daniels | 2,573 | 1.8 | |||
| Total votes | 141,962 | 100.0 | ||||
| Turnout | ||||||
| Democratic gain from Republican | ||||||
1950
| Party | Candidate | Votes | % | |||
|---|---|---|---|---|---|---|
| Republican | Allan O. Hunter | 76,015 | 52 | |||
| Democratic | Cecil F. White (incumbent) | 70,201 | 48 | |||
| Total votes | 146,216 | 100.0 | ||||
| Turnout | ||||||
| Republican gain from Democratic | ||||||
1952
| Party | Candidate | Votes | % | ||
|---|---|---|---|---|---|
| Republican | J. Arthur Younger (incumbent) | 71,426 | 53.1 | ||
| Democratic | Harold F. Taggart | 61,028 | 45.3 | ||
| Progressive | Charles S. Brown | 2,140 | 1.6 | ||
| Total votes | 134,594 | 100.0 | |||
| Turnout | |||||
| Republican win (new seat) | |||||
1954
| Party | Candidate | Votes | % | |
|---|---|---|---|---|
| Republican | J. Arthur Younger (incumbent) | 60,648 | 54.5 | |
| Democratic | Harold F. Taggart | 50,619 | 45.5 | |
| Total votes | 111,267 | 100.0 | ||
| Turnout | ||||
| Republican hold | ||||
1956
| Party | Candidate | Votes | % | |
|---|---|---|---|---|
| Republican | J. Arthur Younger (incumbent) | 96,388 | 60.3 | |
| Democratic | James T. McKay | 63,504 | 39.7 | |
| Total votes | 159,892 | 100.0 | ||
| Turnout | ||||
| Republican hold | ||||
1958
| Party | Candidate | Votes | % | |
|---|---|---|---|---|
| Republican | J. Arthur Younger (incumbent) | 90,735 | 58.8 | |
| Democratic | Elma D. Oddstad | 63,597 | 41.2 | |
| Total votes | 154,332 | 100.0 | ||
| Turnout | ||||
| Republican hold | ||||
1960
| Party | Candidate | Votes | % | |
|---|---|---|---|---|
| Republican | J. Arthur Younger (incumbent) | 116,589 | 59.2 | |
| Democratic | John D. Kaster | 80,227 | 40.8 | |
| Total votes | 196,816 | 100.0 | ||
| Turnout | ||||
| Republican hold | ||||
1962
| Party | Candidate | Votes | % | ||
|---|---|---|---|---|---|
| Democratic | Don Edwards | 79,616 | 66 | ||
| Republican | Joseph F. Donovan | 41,104 | 34 | ||
| Total votes | 120,720 | 100 | |||
| Turnout | |||||
| Democratic win (new seat) | |||||
1964
| Party | Candidate | Votes | % | |
|---|---|---|---|---|
| Democratic | Don Edwards (incumbent) | 115,954 | 69.8 | |
| Republican | Joseph F. Donovan | 50,261 | 30.2 | |
| Total votes | 166,215 | 100.0 | ||
| Turnout | ||||
| Democratic hold | ||||
1966
| Party | Candidate | Votes | % | |
|---|---|---|---|---|
| Democratic | Don Edwards (incumbent) | 97,311 | 63.2 | |
| Republican | Wilbur G. Durkee | 56,784 | 36.8 | |
| Total votes | 154,095 | 100.0 | ||
| Turnout | ||||
| Democratic hold | ||||
1968
| Party | Candidate | Votes | % | |
|---|---|---|---|---|
| Democratic | Don Edwards (incumbent) | 100,891 | 56.5 | |
| Republican | Larry Fargher | 77,521 | 43.5 | |
| Total votes | 178,412 | 100.0 | ||
| Turnout | ||||
| Democratic hold | ||||
1970
| Party | Candidate | Votes | % | |
|---|---|---|---|---|
| Democratic | Don Edwards (incumbent) | 120,041 | 69.1 | |
| Republican | Mark Guerra | 49,556 | 28.5 | |
| American Independent | Edmon V. Kaiser | 4,009 | 2.3 | |
| Total votes | 173,606 | 100.0 | ||
| Turnout | ||||
| Democratic hold | ||||
1972
| Party | Candidate | Votes | % | |
|---|---|---|---|---|
| Democratic | Don Edwards (incumbent) | 123,837 | 72.3 | |
| Republican | Herb Smith | 43,134 | 25.2 | |
| American Independent | Edmon V. Kaiser | 4,403 | 2.5 | |
| Total votes | 171,374 | 100 | ||
| Turnout | ||||
| Democratic hold | ||||
1974
| Party | Candidate | Votes | % | |
|---|---|---|---|---|
| Democratic | Pete Stark (incumbent) | 87,854 | 70.6 | |
| Republican | Edson Adams | 36,522 | 29.4 | |
| Total votes | 124,376 | 100.0 | ||
| Turnout | ||||
| Democratic hold | ||||
1976
| Party | Candidate | Votes | % | |
|---|---|---|---|---|
| Democratic | Pete Stark (incumbent) | 116,398 | 70.8 | |
| Republican | James K. Mills | 44,607 | 27.1 | |
| Peace and Freedom | Albert L. Sargis | 3,386 | 2.1 | |
| Total votes | 164,391 | 100.0 | ||
| Turnout | ||||
| Democratic hold | ||||
1978
| Party | Candidate | Votes | % | |
|---|---|---|---|---|
| Democratic | Pete Stark (incumbent) | 88,179 | 65.4 | |
| Republican | Robert S. Allen | 41,138 | 30.5 | |
| Peace and Freedom | Lawrance J. Phillips | 5,562 | 4.1 | |
| Total votes | 134,879 | 100.0 | ||
| Turnout | ||||
| Democratic hold | ||||
1980
| Party | Candidate | Votes | % | |
|---|---|---|---|---|
| Democratic | Pete Stark (incumbent) | 90,504 | 55.3 | |
| Republican | William J. "Bill" Kennedy | 67,265 | 41.1 | |
| Libertarian | Steven W. Clanin | 5,823 | 3.6 | |
| Total votes | 163,592 | 100.0 | ||
| Turnout | ||||
| Democratic hold | ||||
1982
| Party | Candidate | Votes | % | |
|---|---|---|---|---|
| Democratic | Pete Stark (incumbent) | 104,393 | 60.7 | |
| Republican | William J. "Bill" Kennedy | 67,702 | 39.3 | |
| Total votes | 172,095 | 100.0 | ||
| Turnout | ||||
| Democratic hold | ||||
1984
| Party | Candidate | Votes | % | |
|---|---|---|---|---|
| Democratic | Pete Stark (incumbent) | 136,511 | 69.9 | |
| Republican | J. T. "Eager" Beaver | 51,399 | 26.3 | |
| Libertarian | Martha Fuhrig | 7,398 | 3.8 | |
| Total votes | 195,308 | 100.0 | ||
| Turnout | ||||
| Democratic hold | ||||
1986
| Party | Candidate | Votes | % | |
|---|---|---|---|---|
| Democratic | Pete Stark (incumbent) | 113,490 | 69.7 | |
| Republican | David M. "Dave" Williams | 49,300 | 30.3 | |
| Total votes | 162,790 | 100.0 | ||
| Turnout | ||||
| Democratic hold | ||||
1988
| Party | Candidate | Votes | % | |
|---|---|---|---|---|
| Democratic | Pete Stark (incumbent) | 152,866 | 73 | |
| Republican | Howard Hertz | 56,656 | 27 | |
| Total votes | 214,522 | 100 | ||
| Turnout | ||||
| Democratic hold | ||||
1990
| Party | Candidate | Votes | % | |
|---|---|---|---|---|
| Democratic | Pete Stark (incumbent) | 94,739 | 58.4 | |
| Republican | Victor Romero | 67,412 | 41.6 | |
| Total votes | 162,151 | 100.0 | ||
| Turnout | ||||
| Democratic hold | ||||
1992
| Party | Candidate | Votes | % | |
|---|---|---|---|---|
| Democratic | Ron Dellums (incumbent) | 164,265 | 71.9 | |
| Republican | G. William "Billy" Hunter | 53,707 | 23.5 | |
| Peace and Freedom | Dave Linn | 10,472 | 4.6 | |
| No party | Muss (write-in) | 23 | 0.0 | |
| Total votes | 228,467 | 100.0 | ||
| Turnout | ||||
| Democratic hold | ||||
1994
| Party | Candidate | Votes | % | |
|---|---|---|---|---|
| Democratic | Ron Dellums (incumbent) | 129,233 | 72.25 | |
| Republican | Deborah Wright | 40,448 | 22.61 | |
| Peace and Freedom | Emma Wong Mar | 9,194 | 5.14 | |
| Total votes | 178,875 | 100.0 | ||
| Turnout | ||||
| Democratic hold | ||||
1996
| Party | Candidate | Votes | % | |
|---|---|---|---|---|
| Democratic | Ron Dellums (incumbent) | 154,806 | 77.1 | |
| Republican | Deborah Wright | 37,126 | 18.5 | |
| Peace and Freedom | Tom Condit | 5,561 | 2.7 | |
| Natural Law | Jack Forem | 3,475 | 1.7 | |
| Republican | Omari Musa (write-in) | 8 | 0.0 | |
| Total votes | 200,976 | 100.0 | ||
| Turnout | ||||
| Democratic hold | ||||
1998 (Special)
| Party | Candidate | Votes | % | |
|---|---|---|---|---|
| Democratic | Barbara Lee | 33,497 | 66.81 | |
| Democratic | Greg Harper | 8,048 | 16.05 | |
| Republican | Claiborne Sanders | 6,114 | 12.19 | |
| Democratic | Randal Stewart | 2,481 | 4.95 | |
| Total votes | 50,140 | 100.00 | ||
| Turnout | ||||
| Democratic hold | ||||
1998
| Party | Candidate | Votes | % | |
|---|---|---|---|---|
| Democratic | Barbara Lee (incumbent) | 140,722 | 82.83 | |
| Republican | Claiborne "Clay" Sanders | 22,431 | 13.20 | |
| Peace and Freedom | Gerald Sanders | 4,767 | 2.81 | |
| Natural Law | Walter Ruehlig | 1,975 | 1.16 | |
| Total votes | 169,895 | 100.0 | ||
| Turnout | ||||
| Democratic hold | ||||
2000
| Party | Candidate | Votes | % | |
|---|---|---|---|---|
| Democratic | Barbara Lee (incumbent) | 182,352 | 85.0 | |
| Republican | Arneze Washington | 21,033 | 9.8 | |
| Libertarian | Fred E. Foldvary | 7,051 | 3.3 | |
| Natural Law | Ellen Jefferds | 4,214 | 1.9 | |
| Total votes | 214,650 | 100.0 | ||
| Turnout | ||||
| Democratic hold | ||||
2002
| Party | Candidate | Votes | % | |
|---|---|---|---|---|
| Democratic | Barbara Lee (incumbent) | 135,893 | 85.0 | |
| Republican | Jerald Udinsky | 25,333 | 9.8 | |
| Libertarian | James M. Eyer | 5,685 | 3.4 | |
| Republican | Hector Reyna (write-in) | 6 | 0.0 | |
| Total votes | 166,917 | 100.0 | ||
| Turnout | ||||
| Democratic hold | ||||
2004
| Party | Candidate | Votes | % | |
|---|---|---|---|---|
| Democratic | Barbara Lee (incumbent) | 215,630 | 84.6 | |
| Republican | Claudia Bermudez | 31,278 | 12.3 | |
| Libertarian | James M. Eyer | 8,131 | 3.1 | |
| Total votes | 255,039 | 100.0 | ||
| Turnout | ||||
| Democratic hold | ||||
2006
| Party | Candidate | Votes | % | |
|---|---|---|---|---|
| Democratic | Barbara Lee (incumbent) | 167,245 | 86.4 | |
| Republican | John "J.D." Den Dulk | 20,786 | 10.7 | |
| Libertarian | James M. Eyer | 5,655 | 2.9 | |
| Total votes | 193,686 | 100.0 | ||
| Turnout | ||||
| Democratic hold | ||||
2008
| Party | Candidate | Votes | % | |
|---|---|---|---|---|
| Democratic | Barbara Lee (incumbent) | 238,915 | 86.06 | |
| Republican | Charles Hargrave | 26,917 | 9.70 | |
| Libertarian | James M. Eyer | 11,704 | 4.22 | |
| Total votes | 277,536 | 100.0 | ||
| Turnout | ||||
| Democratic hold | ||||
2010
| Party | Candidate | Votes | % | |
|---|---|---|---|---|
| Democratic | Barbara Lee (incumbent) | 180,400 | 84.27 | |
| Republican | Gerald Hashimito | 23,054 | 10.77 | |
| Green | Dave Heller | 4,848 | 2.27 | |
| Libertarian | James M. Eyer | 4,113 | 1.92 | |
| Peace and Freedom | Larry Allen | 1,670 | 0.78 | |
| Total votes | 214,085 | 100.0 | ||
| Turnout | ||||
| Democratic hold | ||||
2012
| Party | Candidate | Votes | % | |
|---|---|---|---|---|
| Democratic | Jerry McNerney (incumbent) | 118,373 | 55.6 | |
| Republican | Ricky Gill | 94,704 | 44.4 | |
| Total votes | 213,077 | 100.0 | ||
| Democratic hold | ||||
2014
| Party | Candidate | Votes | % | |
|---|---|---|---|---|
| Democratic | Jerry McNerney (incumbent) | 63,475 | 52.4 | |
| Republican | Antonio C. Amador | 57,729 | 47.6 | |
| Total votes | 121,204 | 100.0 | ||
| Democratic hold | ||||
2016
| Party | Candidate | Votes | % | |
|---|---|---|---|---|
| Democratic | Jerry McNerney (incumbent) | 133,163 | 57.4 | |
| Republican | Antonio C. Amador | 98,992 | 42.6 | |
| Total votes | 232,155 | 100.0 | ||
| Democratic hold | ||||
2018
| Party | Candidate | Votes | % | |
|---|---|---|---|---|
| Democratic | Jerry McNerney (incumbent) | 113,414 | 56.5 | |
| Republican | Marla Livengood | 87,349 | 43.5 | |
| Total votes | 200,763 | 100.0 | ||
| Democratic hold | ||||
2020
| Party | Candidate | Votes | % | |
|---|---|---|---|---|
| Democratic | Jerry McNerney (incumbent) | 174,252 | 57.6 | |
| Republican | Antonio C. "Tony" Amador | 128,358 | 42.4 | |
| Total votes | 302,610 | 100.0 | ||
| Democratic hold | ||||
References
- https://www.census.gov/mycd/?st=06&cd=09
- "Citizens Redistricting Commission Final Report, 2011" (PDF).
- "Partisan Voting Index – Districts of the 115th Congress" (PDF). The Cook Political Report. April 7, 2017. Retrieved April 7, 2017.
- "Maps: Final Congressional Districts". Citizens Redistricting Commission. Archived from the original on 2013-03-10. Retrieved February 24, 2013.
- Statement of Vote (2000 President) Archived 2007-06-11 at the Wayback Machine
- Statement of Vote (2000 Senator) Archived 2007-06-11 at the Wayback Machine
- Statement of Vote (2002 Governor) Archived 2010-11-11 at the Wayback Machine
- Statement of Vote (2003 Recall Question) Archived 2011-05-20 at the Wayback Machine
- Statement of Vote (2003 Governor) Archived 2011-05-20 at the Wayback Machine
- Statement of Vote (2004 President) Archived 2010-08-01 at the Wayback Machine
- Statement of Vote (2004 Senator) Archived 2011-08-10 at the Wayback Machine
- Statement of Vote (2006 Governor) Archived 2011-08-10 at the Wayback Machine
- Statement of Vote (2006 Senator) Archived 2011-08-10 at the Wayback Machine
- (2008 President) Archived 2010-07-24 at the Wayback Machine
- Supplement to the Statement of Vote - Counties by Congressional Districts for Governor
- 1920 election results
- 1921 special election results
- 1922 election results
- 1924 election results
- 1926 election results
- 1928 election results
- 1930 election results
- 1932 election results
- 1934 election results
- 1936 election results
- 1938 election results
- 1940 election results
- 1942 election results
- 1944 election results
- 1946 election results
- 1948 election results
- 1950 election results
- 1952 election results
- 1954 election results
- 1956 election results
- 1958 election results
- 1960 election results
- 1962 election results
- 1964 election results
- 1966 election results
- 1968 election results
- 1970 election results
- 1972 election results
- 1974 election results
- 1976 election results
- 1978 election results
- 1980 election results
- 1982 election results
- 1984 election results
- 1986 election results
- 1988 election results
- 1990 election results
- 1992 election results
- 1994 election results
- 1996 election results
- 1998 special election results
- 1998 election results
- 2000 election results
- 2002 general election results Archived February 3, 2009, at the Wayback Machine
- 2004 general election results
- 2006 general election results Archived November 27, 2008, at the Wayback Machine
- 2008 general election results
- 2010 general election results
- 2012 general election results Archived October 19, 2013, at the Wayback Machine
- 2014 general election results
- 2014 general election results
- 2018 general election results
External links
- GovTrack.us: California's 9th congressional district