Connecticut's 4th congressional district
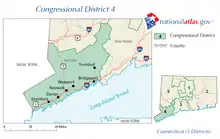
Connecticut's 4th congressional district is a congressional district in the U.S. state of Connecticut. Located in the southwestern part of the state, the district is largely suburban and extends from Bridgeport, the largest city in the state, to Greenwich. The district also extends inland, toward Danbury and toward the Lower Naugatuck Valley.
| Connecticut's 4th congressional district | |||
|---|---|---|---|
.tif.png.webp) Connecticut's 4th congressional district since January 3, 2013 | |||
| Representative |
| ||
| Area | 539 sq mi (1,400 km2) | ||
| Distribution |
| ||
| Population (2019) | 737,733 | ||
| Median household income | $101,646[1] | ||
| Ethnicity |
| ||
| Cook PVI | D+7[2] | ||
Principal cities include: Bridgeport, Norwalk, and Stamford.
The district is currently represented by Democrat Jim Himes.
Towns in the district
The district includes the following towns:
Fairfield County – Bridgeport, Darien, Easton, Fairfield, Greenwich, Monroe, New Canaan, Norwalk, Redding, Ridgefield, Shelton (part), Stamford, Trumbull, Weston, Westport, and Wilton.
New Haven County – Oxford.
Voter registration
| Voter registration and party enrollment as of October 30, 2012[3] | |||||
|---|---|---|---|---|---|
| Party | Active | Inactive | Total | Percentage | |
| Democratic | 141,355 | 9,427 | 150,782 | 36.17% | |
| Republican | 98,663 | 5,106 | 103,769 | 24.89% | |
| Minor Parties | 3,737 | 312 | 4,049 | 0.97% | |
| Unaffiliated | 146,218 | 12,043 | 158,261 | 37.97% | |
| Total | 389,973 | 26,888 | 416,861 | 100.00% | |
Recent presidential elections
| Election results from presidential races | ||
|---|---|---|
| Year | Office | Results |
| 2000 | President | Gore 55–41% |
| 2004 | President | Kerry 52–46% |
| 2008 | President | Obama 60–40% |
| 2012 | President | Obama 55–44% |
| 2016 | President | Clinton 60–37% |
| 2020 | President | Biden 64–35% |
Recent elections
1987 election (special)
| Party | Candidate | Votes | % | ±% | |
|---|---|---|---|---|---|
| Republican | Christopher Shays | 50,518 | 57% | ||
| Democratic | Christine Niedermeier | 37,293 | 42% | ||
| Republican hold | Swing | ||||
| Turnout | 87,811 | 100% | |||
1988 election
| Party | Candidate | Votes | % | ±% | |
|---|---|---|---|---|---|
| Republican | Christopher Shays (incumbent) | 147,843 | 72% | ||
| Democratic | Roger J. Pearson | 55,751 | 27% | ||
| Republican hold | Swing | ||||
| Turnout | 203,594 | 100% | |||
1990 election
| Party | Candidate | Votes | % | ±% | |
|---|---|---|---|---|---|
| Republican | Christopher Shays (incumbent) | 105,682 | 77% | ||
| Democratic | Al Smith | 32,352 | 23% | ||
| Republican hold | Swing | ||||
| Turnout | 138,034 | 100% | |||
1992 election
| Party | Candidate | Votes | % | ±% | |
|---|---|---|---|---|---|
| Republican | Christopher Shays (incumbent) | 147,816 | 67% | ||
| Democratic | Dave Schropfer | 58,666 | 27% | ||
| A Connecticut Party | Al Smith | 11,679 | 5% | ||
| Natural Law | Ronald M. Fried | 1,445 | 1% | ||
| Republican hold | Swing | ||||
| Turnout | 219,606 | 100% | |||
1994 election
| Party | Candidate | Votes | % | ±% | |
|---|---|---|---|---|---|
| Republican | Christopher Shays (incumbent) | 109,436 | 74% | ||
| Democratic | Jonathan Kantrowitz | 34,962 | 24% | ||
| Libertarian | Irving Sussman | 1,976 | 1% | ||
| Natural Law | Terry M. Nevas | 688 | 0.47% | ||
| Republican hold | Swing | ||||
| Turnout | 147,062 | 100% | |||
1996 election
| Party | Candidate | Votes | % | ±% | |
|---|---|---|---|---|---|
| Republican | Christopher Shays (incumbent) | 121,949 | 60% | ||
| Democratic | William Finch | 75,902 | 38% | ||
| Libertarian | Edward H. Tonkin | 2,815 | 1% | ||
| Natural Law | Terry M. Nevas | 1,046 | 1% | ||
| Republican hold | Swing | ||||
| Turnout | 201,712 | 100% | |||
1998 election
| Party | Candidate | Votes | % | ±% | |
|---|---|---|---|---|---|
| Republican | Christopher Shays (incumbent) | 94,767 | 69% | ||
| Democratic | Jonathan Kantrowitz | 40,988 | 28% | ||
| Libertarian | Marshall C. Harrison | 1,449 | 1% | ||
| Republican hold | Swing | ||||
| Turnout | 137,204 | 100% | |||
2000 election
| Party | Candidate | Votes | % | ±% | |
|---|---|---|---|---|---|
| Republican | Christopher Shays (incumbent) | 119,155 | 58% | ||
| Democratic | Stephanie Sanchez | 84,472 | 41% | ||
| Libertarian | Daniel Gislao | 2,034 | 1% | ||
| Independent | Frank M. Don | 1,097 | 0.53% | ||
| Republican hold | Swing | ||||
| Turnout | 206,758 | 100% | |||
2002 election
| Party | Candidate | Votes | % | ±% | |
|---|---|---|---|---|---|
| Republican | Christopher Shays (incumbent) | 113,197 | 64% | ||
| Democratic | Stephanie Sanchez | 62,491 | 36% | ||
| Republican hold | Swing | ||||
| Turnout | 175,688 | 100% | |||
2004 election
| Party | Candidate | Votes | % | ±% | |
|---|---|---|---|---|---|
| Republican | Christopher Shays (incumbent) | 149,891 | 52% | ||
| Democratic | Diane Farrell | 136,481 | 48% | ||
| Republican hold | Swing | ||||
| Turnout | 286,372 | 100% | |||
2006 election
| Party | Candidate | Votes | % | ±% | |
|---|---|---|---|---|---|
| Republican | Christopher Shays (incumbent) | 106,510 | 51% | ||
| Democratic | Diane Farrell | 99,450 | 48% | ||
| Libertarian | Phil Maymin | 3,058 | 1% | ||
| Republican hold | Swing | ||||
| Turnout | 209,018 | 100% | |||
2008 election
| Party | Candidate | Votes | % | ±% | |
|---|---|---|---|---|---|
| Democratic | Jim Himes | 159,694 | 51% | ||
| Republican | Christopher Shays (incumbent) | 147,356 | 47% | ||
| Libertarian | Michael A. Carrano | 2,036 | 1% | ||
| Green | Richard Z. Duffee | 1,377 | 0.44% | ||
| Turnout | 310,463 | 100% | |||
| Democratic gain from Republican | Swing | ||||
2010 election
| Party | Candidate | Votes | % | ±% | |
|---|---|---|---|---|---|
| Democratic | Jim Himes (incumbent) | 115,351 | 53% | ||
| Republican | Daniel Debicella | 102,030 | 47% | ||
| Turnout | 217,381 | 100% | |||
| Democratic hold | Swing | ||||
2012 election
| Party | Candidate | Votes | % | ±% | |
|---|---|---|---|---|---|
| Democratic | Jim Himes (incumbent) | 174,461 | 60% | ||
| Republican | Steve Obsitnik | 117,463 | 40% | ||
| Turnout | 291,924 | 100% | |||
| Democratic hold | Swing | ||||
2014 election
| Party | Candidate | Votes | % | ±% | |
|---|---|---|---|---|---|
| Democratic | Jim Himes (incumbent) | 106,873 | 54% | ||
| Republican | Dan Debicella | 91,922 | 46% | ||
| Turnout | 198,800 | 100% | |||
| Democratic hold | Swing | ||||
2016 election
| Party | Candidate | Votes | % | ±% | |
|---|---|---|---|---|---|
| Democratic | Jim Himes (incumbent) | 185,928 | 60% | ||
| Republican | John Shaban | 123,630 | 40% | ||
| Turnout | 309,558 | 100% | |||
| Democratic hold | Swing | ||||
2018 election
| Party | Candidate | Votes | % | ±% | |
|---|---|---|---|---|---|
| Democratic | Jim Himes (incumbent) | 168,726 | 61% | ||
| Republican | Harry Arora | 106,921 | 38% | ||
| Turnout | 275,651 | 100% | |||
| Democratic hold | Swing | ||||
2020 election
| Party | Candidate | Votes | % | ±% | |
|---|---|---|---|---|---|
| Democratic | Jim Himes (incumbent) | 223,832 | 62% | ||
| Republican | Jonathan Riddle | 130,627 | 36% | ||
| Independent | Brian Merlen | 5,656 | 1% | ||
| Write-in | N/A | 10 | 0% | ||
| Turnout | 360,125 | 100% | |||
| Democratic hold | Swing | ||||
List of members representing the district


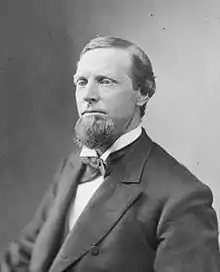

.jpg.webp)


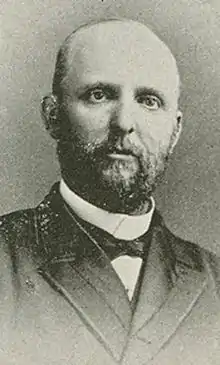


.jpg.webp)


Historical district boundaries
References
- Notes
- https://www.census.gov/mycd/?st=09&cd=04
- "Partisan Voting Index – Districts of the 115th Congress" (PDF). The Cook Political Report. April 7, 2017. Retrieved April 7, 2017.
- "Registration and Party Enrollment Statistics as of October 30, 2012" (PDF). Connecticut Secretary of State. Archived from the original (PDF) on 2006-09-23. Retrieved 2012-10-30.
- Bibliography
- Martis, Kenneth C. (1989). The Historical Atlas of Political Parties in the United States Congress. New York: Macmillan Publishing Company.
- Martis, Kenneth C. (1982). The Historical Atlas of United States Congressional Districts. New York: Macmillan Publishing Company.
- Congressional Biographical Directory of the United States 1774–present
This article is issued from Wikipedia. The text is licensed under Creative Commons - Attribution - Sharealike. Additional terms may apply for the media files.