Delaware's at-large congressional district
Delaware's at-large congressional district is a congressional district that includes the entire U.S. state of Delaware. It is the nation's oldest congressional district, having existed uninterrupted since the 1st United States Congress in 1789.
| Delaware's at-large congressional district | |||
|---|---|---|---|
 | |||
| Representative |
| ||
| Area | 2,489 sq mi (6,450 km2) | ||
| Distribution |
| ||
| Population (2019) | 973,764 | ||
| Median household income | $62,852[2] | ||
| Ethnicity | |||
| Cook PVI | D+6[3] | ||
The district is currently represented by Lisa Blunt Rochester, a Democrat.
Election results from recent presidential races
| Year | Office | Results |
|---|---|---|
| 1992 | President | B. Clinton 44–35% |
| 1996 | President | B. Clinton 52–37% |
| 2000 | President | Gore 55–42% |
| 2004 | President | Kerry 53–45% |
| 2008 | President | Obama 61–36% |
| 2012 | President | Obama 59–40% |
| 2016 | President | H. Clinton 53–42% |
| 2020 | President | Biden 59-40% |
History
Delaware has always had only one member of the United States House of Representatives, except for a single decade from 1813 and 1823, when the state had two at-large members. The two seats were filled by a statewide ballot, with the two candidates receiving the highest votes being elected.
Mike Castle, a Republican and former Governor of Delaware, held this seat from January 1993 until his retirement in January 2011, after his unsuccessful bid for the Republican nomination to run for U.S. Senator. Even as Delaware swung heavily Democratic at the state and national level, Castle was usually reelected without serious difficulty. Since his retirement, however, the Democrats have held it with no substantive opposition.
List of members representing the district
| # | Member | Party | Years | Cong ress |
Electoral history |
|---|---|---|---|---|---|
| 1 | 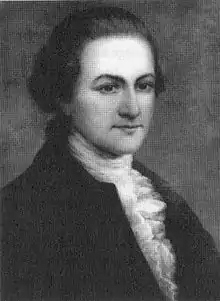 John Vining |
Pro-Administration | March 4, 1789 – March 3, 1793 |
1st 2nd |
Elected in 1789. Re-elected in 1790. Retired. |
| 2 |  John Patten |
Anti-Administration | March 4, 1793 – February 14, 1794 |
3rd | Elected in 1792. Lost election contest. |
| 3 | 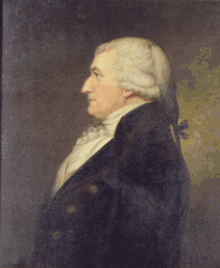 Henry Latimer |
Pro-Administration | February 14, 1794 – February 7, 1795 |
3rd | Won election contest. Lost re-election. |
| 4 | John Patten |
Democratic-Republican | March 4, 1795 – March 3, 1797 |
4th | Elected in 1794. Retired. |
| 5 | 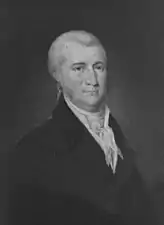 James A. Bayard |
Federalist | March 4, 1797 – March 3, 1803 |
5th 6th 7th |
Elected in 1796. Re-elected in 1798. Re-elected in 1800. Lost re-election. |
| 6 | 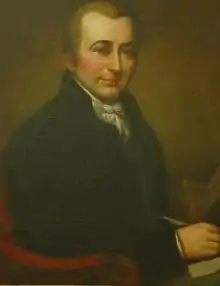 Caesar A. Rodney |
Democratic-Republican | March 4, 1803 – March 3, 1805 |
8th | Elected in 1802. Lost re-election. |
| Vacant | March 4, 1805 – October 1, 1805 |
9th | James A. Bayard was elected in 1804 but declined to serve, having also been elected U.S. senator. | ||
| 7 | James M. Broom | Federalist | October 1, 1805 – October 6, 1807 |
9th 10th |
Elected October 1, 1805 to finish Bayard's term and seated December 2, 1805. Re-elected in 1806, but declined the seat. |
| 8 | 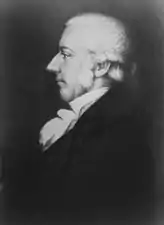 Nicholas Van Dyke |
Federalist | October 6, 1807 – March 3, 1811 |
10th 11th |
Elected to finish Broom's term. Re-elected in 1808. Retired. |
| 9 | 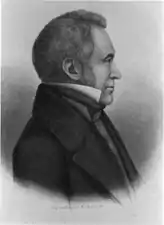 Henry M. Ridgely |
Federalist | March 4, 1811 – March 3, 1815 |
12th 13th |
Elected in 1810. Re-elected in 1812. Retired. |
| 10 |  Thomas Clayton |
Federalist | March 4, 1815 – March 3, 1817 |
14th | Elected in 1814. Lost re-election. |
| 11 | 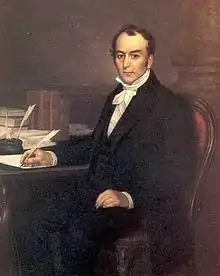 Louis McLane |
Federalist[lower-alpha 1] | March 4, 1817 – March 3, 1825 |
15th 16th 17th 18th 19th |
Elected in 1816. Re-elected in 1818. Re-elected in 1820. Re-elected in 1822. Re-elected in 1824. Re-elected in 1826 but declined to serve having been elected U.S. senator. |
| Jacksonian | March 4, 1825 – March 3, 1827 | ||||
| Vacant | March 3, 1827 – October 2, 1827 |
20th | |||
| 12 | 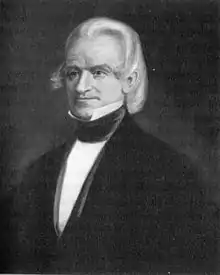 Kensey Johns Jr. |
Anti-Jacksonian | October 2, 1827 – March 3, 1831 |
20th 21st |
Elected October 2, 1827 to finish McLane's term and seated December 3, 1827. Re-elected in 1828. Retired. |
| 13 |  John J. Milligan |
Anti-Jacksonian | March 4, 1831 – March 3, 1837 |
22nd 23rd 24th 25th |
Elected in 1830. Re-elected in 1832. Re-elected in 1834. Re-elected in 1836. Lost re-election. |
| Whig | March 4, 1837 – March 3, 1839 | ||||
| 14 | Thomas Robinson Jr. | Democratic | March 4, 1839 – March 3, 1841 |
26th | Elected in 1838. Lost re-election. |
| 15 | George B. Rodney | Whig | March 4, 1841 – March 3, 1845 |
27th 28th |
Elected in 1840. Re-elected in 1842. Retired. |
| 16 | John W. Houston | Whig | March 4, 1845 – March 3, 1851 |
29th 30th 31st |
Elected in 1844. Re-elected in 1846. Re-elected in 1848. Retired. |
| 17 |  George R. Riddle |
Democratic | March 4, 1851 – March 3, 1855 |
32nd 33rd |
Elected in 1850. Re-elected in 1852. Lost re-election. |
| 18 | Elisha D. Cullen | Know Nothing | March 4, 1855 – March 3, 1857 |
34th | Elected in 1854. Lost re-election. |
| 19 |  William G. Whiteley |
Democratic | March 4, 1857 – March 3, 1861 |
35th 36th |
Elected in 1856. Re-elected in 1858. Retired. |
| 20 |  George P. Fisher |
Unionist | March 4, 1861 – March 3, 1863 |
37th | Elected in 1860. Lost re-election. |
| 21 |  William Temple |
Democratic | March 4, 1863 – May 28, 1863 |
38th | Elected in 1862. Died. |
| Vacant | May 28, 1863 – December 7, 1863 |
38th | |||
| 22 | .jpg.webp) Nathaniel B. Smithers |
Unconditional Unionist | December 7, 1863 – March 3, 1865 |
38th | Elected to finish Temple's term. Lost re-election. |
| 23 |  John A. Nicholson |
Democratic | March 4, 1865 – March 3, 1869 |
39th 40th |
Elected in 1864. Re-elected in 1866. Retired. |
| 24 |  Benjamin T. Biggs |
Democratic | March 4, 1869 – March 3, 1873 |
41st 42nd |
Elected in 1868. Re-elected in 1870. Retired. |
| 25 | James R. Lofland | Republican | March 4, 1873 – March 3, 1875 |
43rd | Elected in 1872. Lost re-election. |
| 26 |  James Williams |
Democratic | March 4, 1875 – March 3, 1879 |
44th 45th |
Elected in 1874. Re-elected in 1876. Retired. |
| 27 | Edward L. Martin | Democratic | March 4, 1879 – March 3, 1883 |
46th 47th |
Elected in 1878. Re-elected in 1880. Retired. |
| 28 | .jpg.webp) Charles B. Lore |
Democratic | March 4, 1883 – March 3, 1887 |
48th 49th |
Elected in 1882. Re-elected in 1884. Retired. |
| 29 | John B. Penington | Democratic | March 4, 1887 – March 3, 1891 |
50th 51st |
Elected in 1886. Re-elected in 1888. Retired. |
| 30 |  John W. Causey |
Democratic | March 4, 1891 – March 3, 1895 |
52nd 53rd |
Elected in 1890. Re-elected in 1892. Retired. |
| 31 |  Jonathan S. Willis |
Republican | March 4, 1895 – March 3, 1897 |
54th | Elected in 1894. Lost re-election. |
| 32 | .jpg.webp) L. Irving Handy |
Democratic | March 4, 1897 – March 3, 1899 |
55th | Elected in 1896. Lost re-election. |
| 33 | 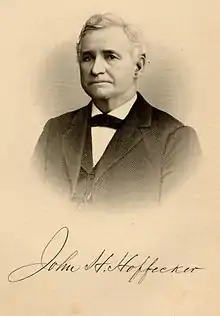 John H. Hoffecker |
Republican | March 4, 1899 – June 16, 1900 |
56th | Elected in 1898. Died. |
| Vacant | June 16, 1900 – November 6, 1900 |
||||
| 34 | Walter O. Hoffecker | Republican | November 6, 1900 – March 3, 1901 |
Elected to finish his father's term. Retired. | |
| 35 |  L. Heisler Ball |
Republican | March 4, 1901 – March 3, 1903 |
57th | Elected in 1900. Retired to run for U.S. senator. |
| 36 | Henry A. Houston | Democratic | March 4, 1903 – March 3, 1905 |
58th | Elected in 1902. Retired. |
| 37 |  Hiram R. Burton |
Republican | March 4, 1905 – March 3, 1909 |
59th 60th |
Elected in 1904. Re-elected in 1906. Lost renomination. |
| 38 | .jpg.webp) William H. Heald |
Republican | March 4, 1909 – March 3, 1913 |
61st 62nd |
Elected in 1908. Re-elected in 1910. Retired. |
| 39 | .jpg.webp) Franklin Brockson |
Democratic | March 4, 1913 – March 3, 1915 |
63rd | Elected in 1912. Lost re-election. |
| 40 |  Thomas W. Miller |
Republican | March 4, 1915 – March 3, 1917 |
64th | Elected in 1914. Lost re-election. |
| 41 | 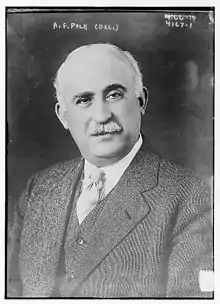 Albert F. Polk |
Democratic | March 4, 1917 – March 3, 1919 |
65th | Elected in 1916. Lost re-election. |
| 42 |  Caleb R. Layton |
Republican | March 4, 1919 – March 3, 1923 |
66th 67th |
Elected in 1918. Re-elected in 1920. Lost re-election. |
| 43 | 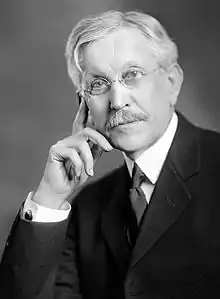 William H. Boyce |
Democratic | March 4, 1923 – March 3, 1925 |
68th | Elected in 1922. Lost re-election. |
| 44 | 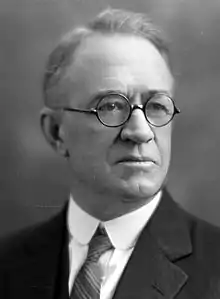 Robert G. Houston |
Republican | March 4, 1925 – March 3, 1933 |
69th 70th 71st 72nd |
Elected in 1924. Re-elected in 1926. Re-elected in 1928. Re-elected in 1930. Retired. |
| 45 | Wilbur L. Adams | Democratic | March 4, 1933 – January 3, 1935 |
73rd | Elected in 1932. Retired to run for U.S. senator. |
| 46 | .jpg.webp) J. George Stewart |
Republican | January 3, 1935 – January 3, 1937 |
74th | Elected in 1934. Lost re-election. |
| 47 | William F. Allen | Democratic | January 3, 1937 – January 3, 1939 |
75th | Elected in 1936. Lost re-election. |
| 48 | George S. Williams | Republican | January 3, 1939 – January 3, 1941 |
76th | Elected in 1938. Lost re-election. |
| 49 | Philip A. Traynor | Democratic | January 3, 1941 – January 3, 1943 |
77th | Elected in 1940. Lost re-election. |
| 50 | Earle D. Willey | Republican | January 3, 1943 – January 3, 1945 |
78th | Elected in 1942. Lost re-election. |
| 51 | Philip A. Traynor | Democratic | January 3, 1945 – January 3, 1947 |
79th | Elected in 1944. Lost re-election. |
| 52 | 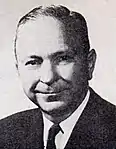 J. Caleb Boggs |
Republican | January 3, 1947 – January 3, 1953 |
80th 81st 82nd |
Elected in 1946. Re-elected in 1948. Re-elected in 1950. Retired to run for Governor of Delaware. |
| 53 | .jpg.webp) Herbert Warburton |
Republican | January 3, 1953 – January 3, 1955 |
83rd | Elected in 1952. Retired to run for U.S. senator. |
| 54 | 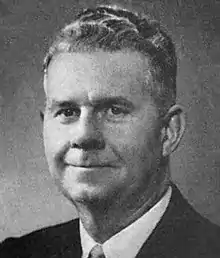 Harris McDowell |
Democratic | January 3, 1955 – January 3, 1957 |
84th | Elected in 1954. Lost re-election. |
| 55 | .jpg.webp) Harry G. Haskell Jr. |
Republican | January 3, 1957 – January 3, 1959 |
85th | Elected in 1956. Lost re-election. |
| 56 | Harris McDowell |
Democratic | January 3, 1959 – January 3, 1967 |
86th 87th 88th 89th |
Elected in 1958. Re-elected in 1960. Re-elected in 1962. Re-elected in 1964. Lost re-election. |
| 57 | 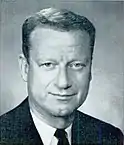 William Roth |
Republican | January 3, 1967 – December 31, 1970 |
90th 91st |
Elected in 1966. Re-elected in 1968. Retired to run for U.S. senator and resigned after the election. |
| Vacant | December 31, 1970 – January 3, 1971 |
91st | |||
| 58 | 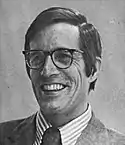 Pete du Pont |
Republican | January 3, 1971 – January 3, 1977 |
92nd 93rd 94th |
Elected in 1970. Re-elected in 1972. Re-elected in 1974. Retired to run for Governor of Delaware. |
| 59 | 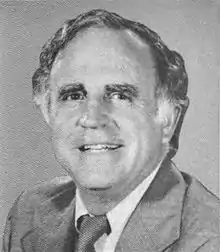 Thomas B. Evans Jr. |
Republican | January 3, 1977 – January 3, 1983 |
95th 96th 97th |
Elected in 1976. Re-elected in 1978. Re-elected in 1980. Lost re-election. |
| 60 | 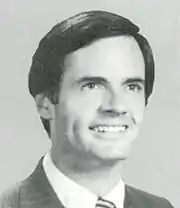 Tom Carper |
Democratic | January 3, 1983 – January 3, 1993 |
98th 99th 100th 101st 102nd |
Elected in 1982. Re-elected in 1984. Re-elected in 1986. Re-elected in 1988. Re-elected in 1990. Retired to run for Governor of Delaware. |
| 61 |  Mike Castle |
Republican | January 3, 1993 – January 3, 2011 |
103rd 104th 105th 106th 107th 108th 109th 110th 111th |
Elected in 1992. Re-elected in 1994. Re-elected in 1996. Re-elected in 1998. Re-elected in 2000. Re-elected in 2002. Re-elected in 2004. Re-elected in 2006. Re-elected in 2008. Retired to run for U.S. senator. |
| 62 |  John Carney |
Democratic | January 3, 2011 – January 3, 2017 |
112th 113th 114th |
Elected in 2010. Re-elected in 2012. Re-elected in 2014. Retired to run for Governor of Delaware. |
| 63 |  Lisa Blunt Rochester |
Democratic | January 3, 2017 – Present |
115th 116th 117th |
Elected in 2016. Re-elected in 2018. Re-elected in 2020. |
Second at-large seat: 1813–1823
From 1813 to 1823, Delaware elected two members of the United States House of Representatives. Both were elected statewide at-large. Four men who held the second seat during that decade.
| # | Member | Party | Years | Cong ress |
Electoral history |
|---|---|---|---|---|---|
| 1 | Thomas Cooper | Federalist | March 4, 1813 – March 3, 1817 |
13th 14th |
Elected in 1812. Re-elected in 1814. Lost re-election. |
| 2 | 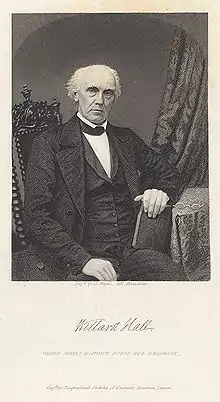 Willard Hall |
Democratic-Republican | March 4, 1817 – January 22, 1821 |
15th 16th |
Elected in 1816. Re-elected in 1818. Lost re-election and resigned early. |
| Vacant | January 22, 1821 – March 3, 1821 |
16th | |||
| 3 | Caesar A. Rodney |
Democratic-Republican | March 4, 1821 – January 24, 1822 |
17th | Elected in 1820. Resigned when elected U.S. senator. |
| Vacant | January 24, 1822 – October 1, 1822 |
||||
| 4 |  Daniel Rodney |
Federalist | October 1, 1822 – March 3, 1823 |
Elected to finish his cousin's term. Retired. | |
Recent election results
1920
| Party | Candidate | Votes | % | |
|---|---|---|---|---|
| Republican | Caleb R. Layton (Incumbent) | 52,145 | 56% | |
| Democratic | James R. Clements | 40,206 | 43% | |
| Socialist | Robert A. Walker | 1,063 | .01% | |
| Independent | Howard T. Ennis | 196 | .02% | |
| Total votes | 93,609 | 100% | ||
| Turnout | ||||
| Republican hold | ||||
1922
| Party | Candidate | Votes | % | |||
|---|---|---|---|---|---|---|
| Democratic | William H. Boyce | 39,126 | 54% | |||
| Republican | Caleb R. Layton (Incumbent) | 32,577 | 45% | |||
| Independent | Frank A. Houck | 908 | .01% | |||
| Total votes | 72,611 | 100% | ||||
| Turnout | ||||||
| Democratic gain from Republican | ||||||
1924
| Party | Candidate | Votes | % | |||
|---|---|---|---|---|---|---|
| Republican | Robert G. Houston | 51,536 | 59% | |||
| Democratic | William H. Boyce (incumbent) | 35,943 | 41% | |||
| Independent | Florence Garvin | 519 | 0.05 | |||
| Total votes | 87,998 | 100% | ||||
| Turnout | ||||||
| Republican gain from Democratic | ||||||
1926
| Party | Candidate | Votes | % | |
|---|---|---|---|---|
| Republican | Robert G. Houston (incumbent) | 38,919 | 52% | |
| Democratic | Merrill H. Tilghman | 35,943 | 48% | |
| Total votes | 74,862 | 100% | ||
| Turnout | ||||
| Republican hold | ||||
1928
| Party | Candidate | Votes | % | |
|---|---|---|---|---|
| Republican | Robert G. Houston (incumbent) | 66,361 | 64% | |
| Democratic | John M. Richardson | 38,045 | 36% | |
| Total votes | 104,406 | 100% | ||
| Turnout | ||||
| Republican hold | ||||
1930
| Party | Candidate | Votes | % | |
|---|---|---|---|---|
| Republican | Robert G. Houston (incumbent) | 48,493 | 56% | |
| Democratic | John P. Le Fevre | 38,391 | 44% | |
| Independent | Arnold Williams | 127 | 0.01% | |
| Total votes | 87,011 | 100% | ||
| Turnout | ||||
| Republican hold | ||||
1932
| Party | Candidate | Votes | % | |||
|---|---|---|---|---|---|---|
| Democratic | Wilbur L. Adams | 51,698 | 46% | |||
| Republican | Reuben Satterthwaite, Jr. | 48,841 | 44% | |||
| Prohibition | Francis B. Short | 10,560 | 9% | |||
| Socialist | Edgar G. Shaeffer | 887 | 0.08% | |||
| Communist | Frank Rhoades | 110 | 0.01% | |||
| Total votes | 112,096 | 100% | ||||
| Turnout | ||||||
| Democratic gain from Republican | ||||||
1934
| Party | Candidate | Votes | % | |||
|---|---|---|---|---|---|---|
| Republican | J. George Stewart | 52,829 | 53% | |||
| Democratic | John C. Hazzard | 45,771 | 46% | |||
| Socialist | William A. Mayor | 404 | 0.4% | |||
| Communist | Joseph P. Daniels | 58 | .006% | |||
| Total votes | 99,062 | 100% | ||||
| Turnout | ||||||
| Republican gain from Democratic | ||||||
1936
| Party | Candidate | Votes | % | |||
|---|---|---|---|---|---|---|
| Democratic | William F. Allen | 65,485 | 52% | |||
| Republican | J. George Stewart (incumbent) | 55,664 | 44% | |||
| Republican | James A. Ellison | 5,338 | 4% | |||
| Socialist | William A. Mayor | 176 | 0.01% | |||
| Total votes | 126,663 | 100% | ||||
| Turnout | ||||||
| Democratic gain from Republican | ||||||
1938
| Party | Candidate | Votes | % | |||
|---|---|---|---|---|---|---|
| Republican | George S. Williams | 60,661 | 56% | |||
| Democratic | William F. Allen (incumbent) | 46,989 | 43% | |||
| Republican | William J. Highfield | 816 | 0.07% | |||
| Progressive | Ralph L. Brown | 105 | 0.01% | |||
| Total votes | 108,571 | 100% | ||||
| Turnout | ||||||
| Republican gain from Democratic | ||||||
1940
| Party | Candidate | Votes | % | |||
|---|---|---|---|---|---|---|
| Democratic | Philip A. Traynor | 68,205 | 51% | |||
| Republican | George S. Williams (incumbent) | 64,384 | 48% | |||
| Independent | Royden C. Caulk | 816 | 0.06% | |||
| Total votes | 133,405 | 100% | ||||
| Turnout | ||||||
| Democratic gain from Republican | ||||||
1980
| Party | Candidate | Votes | % | |
|---|---|---|---|---|
| Republican | Tom Evans (incumbent) | 133,842 | 62% | |
| Democratic | Robert Maxwell | 81,227 | 37% | |
| Libertarian | Lawrence Sullivan | 1,506 | 1% | |
| Total votes | 216,575 | 100% | ||
| Republican hold | ||||
1982
| Party | Candidate | Votes | % | |||
|---|---|---|---|---|---|---|
| Democratic | Thomas R. Carper | 98,533 | 52% | |||
| Republican | Tom Evans (incumbent) | 87,153 | 46% | |||
| American | Mary Gies | 1,109 | 1% | |||
| Libertarian | Richard Cohen | 711 | 0.38% | |||
| N/A | David Nuttall | 558 | 0.30% | |||
| Total votes | 188,064 | 100% | ||||
| Democratic gain from Republican | ||||||
1984
| Party | Candidate | Votes | % | |
|---|---|---|---|---|
| Democratic | Thomas R. Carper (incumbent) | 142,070 | 58% | |
| Republican | Elise du Pont | 100,650 | 41% | |
| Libertarian | V. Luther Etzel | 294 | 0.12% | |
| Total votes | 243,014 | 100% | ||
| Democratic hold | ||||
1986
| Party | Candidate | Votes | % | |
|---|---|---|---|---|
| Democratic | Thomas R. Carper (incumbent) | 106,351 | 66% | |
| Republican | Thomas Nueberger | 53,767 | 33% | |
| American | Patrick Harrison | 639 | 0.40% | |
| Total votes | 160,757 | 100% | ||
| Democratic hold | ||||
1988
| Party | Candidate | Votes | % | |
|---|---|---|---|---|
| Democratic | Thomas R. Carper (incumbent) | 158,338 | 68% | |
| Republican | James P. Krapf | 76,179 | 32% | |
| Total votes | 234,517 | 100% | ||
| Democratic hold | ||||
1990
| Party | Candidate | Votes | % | |
|---|---|---|---|---|
| Democratic | Thomas R. Carper (incumbent) | 116,274 | 66% | |
| Republican | Ralph Williams | 58,037 | 33% | |
| Libertarian | Richard Cohen | 3,121 | 1% | |
| N/A | Write-ins | 3 | <0.01% | |
| Total votes | 177,435 | 100% | ||
| Democratic hold | ||||
1992
| Party | Candidate | Votes | % | |||
|---|---|---|---|---|---|---|
| Republican | Mike Castle | 153,037 | 55% | |||
| Democratic | S. B. Woo | 117,426 | 43% | |||
| Libertarian | Peggy Schmitt | 5,661 | 2% | |||
| Total votes | 276,124 | 100% | ||||
| Republican gain from Democratic | ||||||
1994
| Party | Candidate | Votes | % | |
|---|---|---|---|---|
| Republican | Mike Castle (incumbent) | 137,945 | 71% | |
| Democratic | Carol Ann DeSantis | 51,793 | 27% | |
| Libertarian | Danny Ray Beaver | 3,866 | 2% | |
| Delaware Independent | Donald M. Hockmuth | 1,404 | 0.72% | |
| Total votes | 195,008 | 100% | ||
| Republican hold | ||||
1996
| Party | Candidate | Votes | % | |
|---|---|---|---|---|
| Republican | Mike Castle (incumbent) | 185,577 | 70% | |
| Democratic | Dennis E. Williams | 73,258 | 27% | |
| Libertarian | George A. Jurgensen | 4,000 | 2% | |
| Constitution | Felicia B. Johnson | 3,009 | 1% | |
| Natural Law | Bob Mattson | 987 | 0.37% | |
| Total votes | 266,831 | 100% | ||
| Republican hold | ||||
1998
| Party | Candidate | Votes | % | |
|---|---|---|---|---|
| Republican | Mike Castle (incumbent) | 119,811 | 66% | |
| Democratic | Micheal C. Miller | 57,446 | 32% | |
| Constitution | James P. Webster | 2,411 | 1% | |
| Natural Law | Kim Stanley Bemis | 859 | 1% | |
| N/A | Write-ins | 2 | <0.01% | |
| Total votes | 180,529 | 100% | ||
| Republican hold | ||||
2000
| Party | Candidate | Votes | % | |
|---|---|---|---|---|
| Republican | Mike Castle (incumbent) | 211,797 | 68% | |
| Democratic | Micheal C. Miller | 96,488 | 31% | |
| Constitution | James P. Webster | 2,490 | 0.5% | |
| Libertarian | Brad C. Thomas | 2,351 | 0.5% | |
| Total votes | 313,126 | 100% | ||
| Republican hold | ||||
2002
| Party | Candidate | Votes | % | |
|---|---|---|---|---|
| Republican | Mike Castle (incumbent) | 164,605 | 72% | |
| Democratic | Micheal C. Miller | 61,011 | 27% | |
| Libertarian | Brad C. Thomas | 2,789 | 1% | |
| Total votes | 228,405 | 100% | ||
| Republican hold | ||||
2004
| Party | Candidate | Votes | % | |
|---|---|---|---|---|
| Republican | Mike Castle (incumbent) | 245,978 | 69% | |
| Democratic | Paul Donnelly | 105,716 | 30% | |
| Delaware Independent | Maurice J. Barros (write-in) | 2,337 | 0.5% | |
| Libertarian | William E. Morris | 2,014 | 0.5% | |
| Total votes | 356,045 | 100% | ||
| Republican hold | ||||
2006
| Party | Candidate | Votes | % | |
|---|---|---|---|---|
| Republican | Mike Castle (incumbent) | 143,897 | 57% | |
| Democratic | Dennis Spivack | 97,565 | 39% | |
| Delaware Independent | Karen M. Hartley-Nagle | 5,769 | 2% | |
| Green | Michael Berg | 4,463 | 2% | |
| Total votes | 251,694 | 100% | ||
| Republican hold | ||||
2008
| Party | Candidate | Votes | % | |
|---|---|---|---|---|
| Republican | Michael Castle (incumbent) | 235,437 | 61% | |
| Democratic | Karen Hartley-Nagle | 146,434 | 38% | |
| Libertarian | Mark Parks | 3,586 | 1% | |
| Total votes | 385,457 | 100% | ||
| Republican hold | ||||
2010
| Party | Candidate | Votes | % | |||
|---|---|---|---|---|---|---|
| Democratic | John Carney | 173,543 | 57% | |||
| Republican | Glen Urquhart | 125,442 | 41% | |||
| Delaware Independent | Earl R. Lofland | 3,704 | 1% | |||
| Libertarian | Brent Wangen | 1,986 | 1% | |||
| Independent | Jeffrey Brown | 961 | 0.31% | |||
| Total votes | 305,636 | 100% | ||||
| Turnout | ||||||
| Democratic gain from Republican | ||||||
2012
| Party | Candidate | Votes | % | |
|---|---|---|---|---|
| Democratic | John Carney (incumbent) | 249,905 | 64% | |
| Republican | Tom Kovach | 129,749 | 33% | |
| Green | Bernard August | 4,273 | 2% | |
| Libertarian | Scott Gesty | 4,096 | 1% | |
| Total votes | 388,023 | 100% | ||
| Democratic hold | ||||
2014
| Party | Candidate | Votes | % | |
|---|---|---|---|---|
| Democratic | John Carney (incumbent) | 137,251 | 59% | |
| Republican | Rose Izzo | 85,146 | 37% | |
| Green | Bernard August | 4,801 | 2% | |
| Libertarian | Scott Gesty | 4,419 | 2% | |
| Total votes | 231,617 | 100% | ||
| Democratic hold | ||||
2016
| Party | Candidate | Votes | % | |
|---|---|---|---|---|
| Democratic | Lisa Blunt Rochester | 233,554 | 56% | |
| Republican | Hans Reigle | 172,301 | 41% | |
| Green | Mark Andrew Perri | 8,326 | 2% | |
| Libertarian | Scott Gesty | 6,436 | 2% | |
| Total votes | 420,617 | 100% | ||
| Democratic hold | ||||
2018
| Party | Candidate | Votes | % | |
|---|---|---|---|---|
| Democratic | Lisa Blunt Rochester (incumbent) | 227,353 | 64.5% | |
| Republican | Scott Walker | 125,384 | 35.5% | |
| Turnout | 352,737 | 46.1% | ||
| Total votes | 352,737 | 100% | ||
| Democratic hold | ||||
2020
| Party | Candidate | Votes | % | ||
|---|---|---|---|---|---|
| Democratic | Lisa Blunt Rochester (incumbent) | 281,382 | 57.6% | ||
| Republican | Lee Murphy | 196,392 | 40.2% | ||
| Delaware Independent | Catherine S. Purcell | 6,682 | 1.3% | ||
| Libertarian | David L. Rogers | 3,814 | 0.7% | ||
| Turnout | |||||
| Total votes | 488,270 | 100% | |||
| Democratic hold | |||||
Notes
- Supported the Crawford faction in the 1824 United States presidential election
References
- Barone, Michael; Richard E. Cohen (2005). The Almanac of American Politics. Washington: National Journal Group. ISBN 0-89234-112-2.
- Martin, Roger A. (1995). Memoirs of the Senate. Newark, DE: Roger A. Martin.
- "Urban Rural Population United States in 2010 – Distribution". Statista. Archived from the original on 1 February 2018. Retrieved 7 May 2018.
- https://www.census.gov/mycd/?st=10
- "Partisan Voting Index – Districts of the 115th Congress" (PDF). The Cook Political Report. April 7, 2017. Archived (PDF) from the original on June 7, 2017. Retrieved April 7, 2017.
- Representatives, Office of the Clerk, U.S. House of. "Office of the Clerk of the U.S. House of Representatives – 404". clerk.house.gov. Archived from the original on March 25, 2016. Retrieved May 7, 2018.
- Representatives, Office of the Clerk, U.S. House of. "Office of the Clerk of the U.S. House of Representatives – 404". clerk.house.gov. Archived from the original on March 4, 2016. Retrieved May 7, 2018.
- Representatives, Office of the Clerk, U.S. House of. "Office of the Clerk of the U.S. House of Representatives – 404". clerk.house.gov. Archived from the original on February 27, 2015. Retrieved May 7, 2018.
- Representatives, Office of the Clerk, U.S. House of. "Office of the Clerk of the U.S. House of Representatives – 404". clerk.house.gov. Archived from the original on March 25, 2016. Retrieved May 7, 2018.
- Representatives, Office of the Clerk, U.S. House of. "Office of the Clerk of the U.S. House of Representatives – 404". clerk.house.gov. Archived from the original on March 17, 2016. Retrieved May 7, 2018.
- Representatives, Office of the Clerk, U.S. House of. "Office of the Clerk of the U.S. House of Representatives – 404". clerk.house.gov. Archived from the original on March 24, 2016. Retrieved May 7, 2018.
- Representatives, Office of the Clerk, U.S. House of. "Office of the Clerk of the U.S. House of Representatives – 404". clerk.house.gov. Archived from the original on March 26, 2016. Retrieved May 7, 2018.
- Representatives, Office of the Clerk, U.S. House of. "Office of the Clerk of the U.S. House of Representatives – 404". clerk.house.gov. Archived from the original on March 4, 2016. Retrieved May 7, 2018.
- Representatives, Office of the Clerk, U.S. House of. "Office of the Clerk of the U.S. House of Representatives – 404". clerk.house.gov. Archived from the original on June 10, 2011. Retrieved May 7, 2018.
- Representatives, Office of the Clerk, U.S. House of. "Office of the Clerk of the U.S. House of Representatives – 404". clerk.house.gov. Archived from the original on June 10, 2011. Retrieved May 7, 2018.
- "2000 ELECTION STATISTICS". clerk.house.gov. Archived from the original on July 21, 2011. Retrieved May 7, 2018.
- "2002 ELECTION STATISTICS". clerk.house.gov. Archived from the original on January 5, 2007. Retrieved May 7, 2018.
- "2004 ELECTION STATISTICS". clerk.house.gov. Archived from the original on June 10, 2011. Retrieved May 7, 2018.
- "2006 Election Statistics". clerk.house.gov. Archived from the original on January 30, 2008. Retrieved May 7, 2018.
- "State of Delaware Primary Election Official Results". State of Delaware. Archived from the original on November 7, 2012. Retrieved November 7, 2012.
- "State of Delaware General Election (Official Results)". State of Delaware Election Commissioner. Archived from the original on November 26, 2014. Retrieved November 27, 2014.
External link
- "Our Campaigns - United States - Delaware - DE - At-Large". www.ourcampaigns.com. Retrieved January 14, 2021.