Fenland District Council elections
Fenland District Council in Cambridgeshire, England is elected every four years. Since the last boundary changes in 2015, 39 councillors have been elected from 24 wards.[1]
Fenland rejected the introduction of a directly elected mayor by 17,296 votes to 5,509, on a turnout of just under 34%, in a referendum held in July 2005.[2]
Political control
Since the foundation of the council in 1973 political control of the council has been held by the following parties:[3]
| Control | Dates | |
|---|---|---|
| No overall control | 1973 – 1976 | |
| Conservative | 1976 – 1995 | |
| Labour | 1995 – 1999 | |
| Conservative | 1999 – present | |
Council elections
| Election | Conservative | Labour | Liberal Democrat[lower-alpha 1] | Green | Others | Total |
|---|---|---|---|---|---|---|
| 1973[4][5] | 20 | 8 | 0 | 0 | 12 | 40 |
| 1976[4][6] | 27 | 8 | 1 | 0 | 4 | 40[lower-alpha 2] |
| 1979[4] | 24 | 6 | 3 | 0 | 7 | 40 |
| 1983[4][7] | 22 | 8 | 6 | 0 | 4 | 40 |
| 1987[4][8] | 25 | 4 | 6 | 0 | 5 | 40 |
| 1991[4][9] | 27 | 6 | 2 | 0 | 5 | 40[lower-alpha 3] |
| 1995[10] | 14 | 21 | 2 | 0 | 3 | 40 |
| 1999[11][12] | 28 | 7 | 1 | 0 | 3 | 40[lower-alpha 4] |
| 2003[13] | 36 | 3 | 0 | 0 | 1 | 40[lower-alpha 5] |
| 2007[14] | 39 | 0 | 0 | 0 | 1 | 40 |
| 2011[15] | 34 | 0 | 2 | 0 | 4 | 40 |
| 2015 | 34 | 0 | 2 | 0 | 3 | 39[lower-alpha 6] |
| 2019[16] | 26 | 0 | 2 | 1 | 10 | 39 |
- Notes:
- Liberal Party prior to 1982, SDP-Liberal Alliance from 1982 to 1988.
- New ward boundaries: The District of Fenland (Electoral Arrangements) Order 1975.
- Minor alterations to district boundaries: The Cambridgeshire, Essex, Hertfordshire and Lincolnshire (County Boundaries) Order 1989 and The Cambridgeshire, Norfolk and Suffolk (County Boundaries) Order 1990.
- One seat was left vacant at this election.
- New ward boundaries: The District of Fenland (Electoral Changes) Order 2002.
- New ward boundaries: The Fenland (Electoral Changes) Order 2014.
District result maps
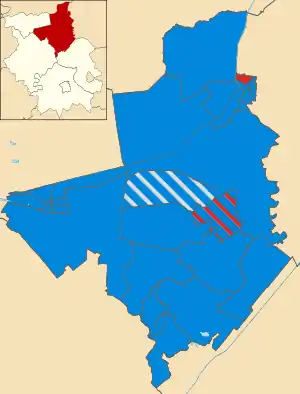 2003 results map
 2007 results map
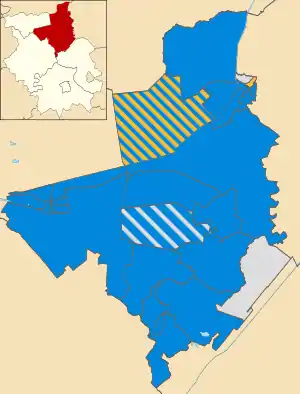 2011 results map
By-election results
1995-1999
| Party | Candidate | Votes | % | ±% | |
|---|---|---|---|---|---|
| Conservative | 278 | 50.1 | |||
| Labour | 133 | 24.0 | |||
| Independent | 98 | 17.6 | |||
| Liberal Democrats | 46 | 8.2 | |||
| Majority | 145 | 26.1 | |||
| Turnout | 555 | 50.6 | |||
| Conservative gain from Labour | Swing | ||||
| Party | Candidate | Votes | % | ±% | |
|---|---|---|---|---|---|
| Conservative | 434 | 56.7 | +10.8 | ||
| Labour | 252 | 32.9 | -21.2 | ||
| Independent | 79 | 10.3 | +10.3 | ||
| Majority | 182 | 23.8 | |||
| Turnout | 765 | 24.4 | |||
| Conservative gain from Labour | Swing | ||||
| Party | Candidate | Votes | % | ±% | |
|---|---|---|---|---|---|
| Labour | 574 | 50.6 | -0.3 | ||
| Conservative | 561 | 49.4 | +0.3 | ||
| Majority | 13 | 1.2 | |||
| Turnout | 1,135 | 27.7 | |||
| Labour hold | Swing | ||||
| Party | Candidate | Votes | % | ±% | |
|---|---|---|---|---|---|
| Labour | 707 | 59.4 | +8.2 | ||
| Conservative | 483 | 40.6 | +10.0 | ||
| Majority | 224 | 18.8 | |||
| Turnout | 1,190 | ||||
| Labour hold | Swing | ||||
1999-2003
| Party | Candidate | Votes | % | ±% | |
|---|---|---|---|---|---|
| Conservative | 298 | 71.8 | +71.8 | ||
| Labour | 57 | 13.7 | -37.3 | ||
| Liberal Democrats | 42 | 10.1 | -38.9 | ||
| Independent Labour | 18 | 4.3 | +4.3 | ||
| Majority | 241 | 58.1 | |||
| Turnout | 415 | 37.6 | |||
| Conservative gain from Labour | Swing | ||||
| Party | Candidate | Votes | % | ±% | |
|---|---|---|---|---|---|
| Labour | 1,596 | 49.6 | |||
| Conservative | 1,366 | 42.4 | |||
| Liberal Democrats | 258 | 8.0 | |||
| Majority | 230 | 7.2 | |||
| Turnout | 3,220 | ||||
| Labour gain from Conservative | Swing | ||||
| Party | Candidate | Votes | % | ±% | |
|---|---|---|---|---|---|
| Conservative | 402 | 49.2 | +2.0 | ||
| Liberal Democrats | 343 | 42.0 | -0.8 | ||
| Labour | 72 | 8.8 | -1.2 | ||
| Majority | 59 | 7.2 | |||
| Turnout | 817 | 25.7 | |||
| Conservative hold | Swing | ||||
| Party | Candidate | Votes | % | ±% | |
|---|---|---|---|---|---|
| Conservative | 546 | 65.4 | +20.5 | ||
| Labour | 289 | 34.6 | +10.1 | ||
| Majority | 257 | 30.8 | |||
| Turnout | 835 | 16.5 | |||
| Conservative hold | Swing | ||||
2003-2007
| Party | Candidate | Votes | % | ±% | |
|---|---|---|---|---|---|
| Conservative | Philip Hatton | 501 | 50.2 | -21.9 | |
| Liberal Democrats | Maddy Forster | 254 | 25.5 | +25.5 | |
| Independent | 155 | 15.5 | +15.5 | ||
| Labour | 88 | 8.8 | -19.1 | ||
| Majority | 247 | 24.7 | |||
| Turnout | 998 | 21.0 | |||
| Conservative hold | Swing | ||||
| Party | Candidate | Votes | % | ±% | |
|---|---|---|---|---|---|
| Conservative | Robert Sears | 264 | 45.0 | ||
| Liberal Democrats | Christopher Howes | 136 | 23.2 | ||
| Independent | Mark Archer | 136 | 23.2 | ||
| Independent | Stephen Wilson | 39 | 6.6 | ||
| Labour | Richard Hibbert | 12 | 2.0 | ||
| Majority | 128 | 21.8 | |||
| Turnout | 587 | 42.1 | |||
| Conservative hold | Swing | ||||
| Party | Candidate | Votes | % | ±% | |
|---|---|---|---|---|---|
| Conservative | Florence Newell | 259 | 57.2 | +17.8 | |
| Liberal Democrats | Christopher Howes | 194 | 42.8 | +12.0 | |
| Majority | 65 | 14.4 | |||
| Turnout | 453 | 26.7 | |||
| Conservative hold | Swing | ||||
2007-2011
| Party | Candidate | Votes | % | ±% | |
|---|---|---|---|---|---|
| Conservative | Phil Wait | 646 | 61.8 | ||
| Labour | Dave Goode | 191 | 18.3 | ||
| Independent | Paul Carpenter | 119 | 11.4 | ||
| UKIP | Paul Clapp | 55 | 5.3 | ||
| Liberal Democrats | Chris Howes | 35 | 3.3 | ||
| Majority | 455 | 43.5 | |||
| Turnout | 1,046 | ||||
| Conservative hold | Swing | ||||
| Party | Candidate | Votes | % | ±% | |
|---|---|---|---|---|---|
| Conservative | Robert Scrimshaw | 512 | 50.6 | ||
| Liberal Democrats | Gavin Booth | 208 | 20.6 | ||
| Labour | Dave Goode | 190 | 18.8 | ||
| Green | Paul Carpenter | 101 | 10.0 | ||
| Majority | 304 | 30.0 | |||
| Turnout | 1,011 | ||||
| Conservative hold | Swing | ||||
| Party | Candidate | Votes | % | ±% | |
|---|---|---|---|---|---|
| Conservative | Steve Count | 803 | 53.9 | -5.2 | |
| Labour | Martin Field | 460 | 29.9 | +29.9 | |
| Liberal Democrats | Ann Elliott | 250 | 16.2 | -24.7 | |
| Majority | 370 | 24.0 | |||
| Turnout | 1,540 | 28 | |||
| Conservative hold | Swing | ||||
| Party | Candidate | Votes | % | ±% | |
|---|---|---|---|---|---|
| Conservative | Robert Chambers | 301 | 45.9 | -11.2 | |
| Liberal Democrats | Christopher Howes | 264 | 40.2 | -2.7 | |
| UKIP | Sandra Rylance | 58 | 8.8 | +8.8 | |
| Labour | Max Kelly | 33 | 5.0 | +5.0 | |
| Majority | 37 | 5.7 | |||
| Turnout | 656 | 31.8 | |||
| Conservative hold | Swing | ||||
| Party | Candidate | Votes | % | ±% | |
|---|---|---|---|---|---|
| Liberal Democrats | Dave Patrick | 287 | 51.3 | ||
| Conservative | Steve Tierney | 145 | 25.9 | ||
| Labour | Barry Diggle | 74 | 13.2 | ||
| UKIP | Paul Clapp | 54 | 9.6 | ||
| Majority | 142 | 25.4 | |||
| Turnout | 560 | 31.1 | |||
| Liberal Democrats gain from Conservative | Swing | ||||
2011-2015
| Party | Candidate | Votes | % | ±% | |
|---|---|---|---|---|---|
| Conservative | David Hodgson | 228 | 42.0 | -13.1 | |
| Labour | John White | 166 | 30.6 | +1.8 | |
| Liberal Democrats | Robert McLaren | 90 | 16.6 | +16.6 | |
| UKIP | Will Schooling | 39 | 7.2 | -8.9 | |
| Independent | Phil Webb | 20 | 3.7 | +3.7 | |
| Majority | 62 | 11.4 | |||
| Turnout | 543 | 28.8 | |||
| Conservative hold | Swing | ||||
References
- "Elections Explained". Fenland District Council. Retrieved 2017-01-26.
- "Result: Mayoral Referendum". Fenland Citizen. 18 July 2005. Retrieved 13 September 2011.
- "Fenland". BBC News Online. Retrieved 2009-09-09.
- Local elections in Britain: a statistical digest, edited by Colin Rallings and Michael Thrasher. 1993
- The Times reported this election result as Conservative 18, Labour 8, Independent 14. "Liberals capture Eastbourne and exceed ambition to win 1,000 loval government seats". The Times. 9 June 1973.
- "Heavy Labour losses in district polls". The Times. 8 May 1976.
- The Times reported this election result as Conservative 19, Labour 8, Liberal 4, SDP 2, Independent 7. "How votes were cast in local government elections". The Times. 7 May 1983.
- "Results in Thursday's local elections". The Times. 9 May 1987.
- The Times reported this election result as Conservative 28, Labour 6, Liberal Democrat 2, Independent 4. "Complete round-up of results from Thursday's local council elections". The Times. 4 May 1991.
- "Complete list of results from Thursday's council elections". The Times. 6 May 1995. p. 10.
- "How the Nations Voted". The Times. 8 May 1999.
- "Fenland". BBC News. Retrieved 26 January 2017.
- "Fenland". BBC News. Retrieved 26 January 2017.
- "Fenland". BBC News. 5 May 2007. Retrieved 26 January 2017.
- "Fenland". BBC News. Retrieved 26 January 2017.
- "Fenland". BBC News. 3 May 2019. Retrieved 14 May 2019.
- "Comfortable winner Sears". Cambs Times. 10 February 2006. Retrieved 13 September 2011.
- Rory, Carroll (2006-07-19). "Election: Florence back on council". Fenland Citizen.
- "Convincing win for Conservatives". Peterborough Evening Telegraph. 2008-04-12.
- "Result of Poll Parson Drove and Wisbech St Mary Ward". Fenland District Council. Archived from the original on 2010-04-26. Retrieved 2009-09-09.
- "Tories keep it 39 out of 40 with decisive by election contest for Fenland District Council". The Cambs Times. 2009-10-09. Retrieved 2009-10-09.
- "Declaration of Result - The Mills Ward of Fenland District Council". Fenland District Council. Retrieved 2010-03-05.
- "Dave Patrick stuns Tories and wins Wisbech seat on Fenland District Council for Lib Dems". Wisbech Standard. 2010-04-16. Retrieved 2010-04-16.
- "Tories retain Staithe seat on Fenland Council despite 7% swing towards Labour". Wisbech Standard. 23 September 2011. Retrieved 23 September 2011.
External links
| Cambridgeshire County Council | |
|---|---|
| Peterborough City Council | |
| Cambridge City Council | |
| East Cambridgeshire District Council | |
| Fenland District Council | |
| Huntingdonshire District Council | |
| South Cambridgeshire District Council | |
| Isle of Ely County Council |
|
| Huntingdon & Peterborough County Council |
|
| Mayor of Cambridgeshire and Peterborough | |
| |
This article is issued from Wikipedia. The text is licensed under Creative Commons - Attribution - Sharealike. Additional terms may apply for the media files.