2018 Cambridge City Council election
The 2018 Cambridge City Council election took place on 3 May 2018 to elect members of Cambridge City Council in England. This was on the same day as other nationwide local elections.
| Party | Seats | Gains | Losses | Net gain/loss | Seats % | Votes % | Votes | +/− | |
|---|---|---|---|---|---|---|---|---|---|
| Labour | 10 | 1 | 1 | 0 | 66.6 | 46.4 | 17,086 | +0.5 | |
| Liberal Democrats | 5 | 2 | 1 | +1 | 33.3 | 31.9 | 11,736 | +4.4 | |
| Conservative | 0 | 0 | 0 | 0 | 0 | 12.7 | 4,681 | +0.9 | |
| Green | 0 | 0 | 0 | 0 | 0 | 8.7 | 3,206 | -1.3 | |
| UKIP | 0 | 0 | 0 | 0 | 0 | 0.3 | 93 | -2.2 | |
| Libertarian | 0 | 0 | 0 | 0 | 0 | 0.1 | 26 | +0.1 | |
| Independent | 0 | 0 | 1 | -1 | 0 | 0 | 0 | -2.3 | |
- For the city council election in Cambridge, Ontario see 2018 Waterloo Region municipal elections#Cambridge
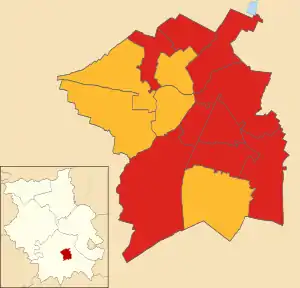
Map of the results of the 2018 Cambridge City Council election. Labour in red and Liberal Democrats in yellow.
| Party | Previous council | Staying councillors | Seats up for election | Election result | New council | |
|---|---|---|---|---|---|---|
| Labour | 25 | 16 | 9 | 10 | 26 | |
| Liberal Democrats | 13 | 9 | 4 | 5 | 14 | |
| Green | 1 | 1 | 0 | 0 | 1 | |
| Independent | 2 | 1 | 1 | 0 | 1 | |
| Total | 41 | 27 | 13 | 15 | 42 | |
Note the totals are affected by an off-cycle vacancy in East Chesteron, meaning the council was one member short going in and an extra (vacant) seat was contested.
Ward results
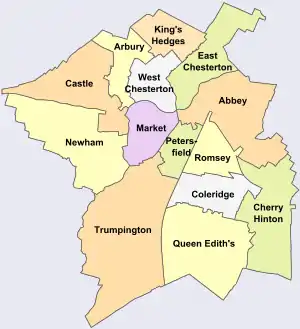
Map showing the wards of Cambridge Council
Abbey
| Party | Candidate | Votes | % | ±% | |
|---|---|---|---|---|---|
| Labour | Nicky Massey | 1,283 | 57.0 | -4.3 | |
| Liberal Democrats | Nicky Shepard | 466 | 20.7 | +7.5 | |
| Conservative | David Philip Smith | 263 | 11.7 | +0.7 | |
| Green | Naomi Anne Bennett | 240 | 10.6 | -3.9 | |
| Turnout | 2,252 | ||||
| Labour hold | Swing | ||||
Arbury
| Party | Candidate | Votes | % | ±% | |
|---|---|---|---|---|---|
| Labour | Patrick Sheil | 1,250 | 51.8 | -9.7 | |
| Liberal Democrats | Tim Ward | 595 | 24.6 | +8.8 | |
| Conservative | Dylan Coll-Reed | 351 | 14.5 | +2.4 | |
| Green | Stephen Roger Lawrence | 219 | 9.1 | -1.4 | |
| Turnout | 2,415 | ||||
| Labour hold | Swing | ||||
Castle
| Party | Candidate | Votes | % | ±% | |
|---|---|---|---|---|---|
| Liberal Democrats | Cheney-Anne Payne | 957 | 40.8 | +21.8 | |
| Labour | Mark Reader | 932 | 39.8 | +12.3 | |
| Conservative | Othman Bankole Cole | 245 | 10.5 | +4.2 | |
| Green | Lucas Ruzowitzky | 184 | 7.8 | -1.5 | |
| Libertarian | Aidan Christopher Ulrich Powlesland | 26 | 1.1 | New | |
| Turnout | |||||
| Liberal Democrats gain from Independent | Swing | ||||
Cherry Hinton
| Party | Candidate | Votes | % | ±% | |
|---|---|---|---|---|---|
| Labour | Russ McPherson | 1,282 | 56.8 | -4.0 | |
| Conservative | Eric William Barrett-Payton | 441 | 19.5 | +3.3 | |
| Liberal Democrats | John Louis Oakes | 364 | 16.1 | +6.8 | |
| Green | Jenny Richens | 171 | 7.6 | +1.3 | |
| Turnout | 2,258 | ||||
| Labour hold | Swing | ||||
Coleridge
| Party | Candidate | Votes | % | ±% | |
|---|---|---|---|---|---|
| Labour | Lewis Herbert | 1,303 | 55.9 | -4.4 | |
| Liberal Democrats | Lindsey Noah Tate | 410 | 17.6 | +7.6 | |
| Conservative | Donald Fisher Douglas | 388 | 16.7 | +1.9 | |
| Green | Sarah Louise Nicmanis | 228 | 9.8 | +1.8 | |
| Turnout | 2,329 | ||||
| Labour hold | Swing | ||||
East Chesterton
| Party | Candidate | Votes | % | ±% | |
|---|---|---|---|---|---|
| Labour | Carla Louise McQueen | 1,362 | 45.9 | +4.3 | |
| Labour | Baijumon Thittalayil Varkey | 1,107 | |||
| Liberal Democrats | Owen Stewart Dunn | 830 | 28.0 | -6.2 | |
| Liberal Democrats | Shahida Rahman | 811 | |||
| Green | Gareth Peter Bailey | 345 | 11.6 | +4.9 | |
| Conservative | Thomas Hedley Fairfax Harwood | 336 | 11.3 | +1.4 | |
| Conservative | Timur Coskun | 299 | |||
| UKIP | Peter Burkinshaw | 93 | 3.1 | -4.5 | |
| Turnout | |||||
| Labour hold | Swing | ||||
| Labour hold | Swing | ||||
Two seats were up due to the resignation of Margery Abbott (Labour, elected 2016) [3]
King's Hedges
| Party | Candidate | Votes | % | ±% | |
|---|---|---|---|---|---|
| Labour | Martin Smart | 924 | 51.7 | -2.8 | |
| Liberal Democrats | Daniele Josephine Gibney | 397 | 22.2 | +8.5 | |
| Conservative | Anette Karimi | 302 | 16.9 | +5.1 | |
| Green | Angela Ditchfield | 165 | 9.2 | +0.8 | |
| Turnout | 1,788 | ||||
| Labour hold | Swing | ||||
Market
| Party | Candidate | Votes | % | ±% | |
|---|---|---|---|---|---|
| Liberal Democrats | Anthony William Martinelli | 866 | 43.5 | +5.0 | |
| Labour | Dan Ratcliffe | 744 | 37.3 | +1.8 | |
| Green | Jeremy Lloyd Caddick | 229 | 11.5 | -8.4 | |
| Conservative | Henry James Mitson | 153 | 7.7 | +1.5 | |
| Turnout | 1,992 | ||||
| Liberal Democrats gain from Labour | Swing | ||||
Newnham
| Party | Candidate | Votes | % | ±% | |
|---|---|---|---|---|---|
| Liberal Democrats | Rod Cantrill | 1,139 | 49.7 | +6.5 | |
| Labour | Michael Davey | 825 | 36.0 | -0.2 | |
| Conservative | Connor Gregory George MacDonald | 165 | 7.2 | -3.6 | |
| Green | Mark Slade | 164 | 7.2 | -2.7 | |
| Turnout | 2,293 | ||||
| Liberal Democrats hold | Swing | ||||
Petersfield
| Party | Candidate | Votes | % | ±% | |
|---|---|---|---|---|---|
| Labour | Ann Marie Sinnott | 1,256 | 58.3 | -3.1 | |
| Liberal Democrats | Sarah Brown | 432 | 20.0 | +7.0 | |
| Green | Virgil Au Wenhan Ierubino | 278 | 12.9 | -2.2 | |
| Conservative | Simon Lee | 189 | 8.8 | -1.6 | |
| Turnout | 2,155 | ||||
| Labour hold | Swing | ||||
Queen Edith's
| Party | Candidate | Votes | % | ±% | |
|---|---|---|---|---|---|
| Liberal Democrats | Colin Stephen McGerty | 1,259 | 44.2 | +1.2 | |
| Labour | Dan Greef | 827 | 29.0 | ±0.0 | |
| Conservative | Manas Deb | 543 | 19.1 | -0.6 | |
| Green | Joel Chalfen | 218 | 7.7 | -0.7 | |
| Turnout | 2,847 | ||||
| Liberal Democrats hold | Swing | ||||
Romsey
| Party | Candidate | Votes | % | ±% | |
|---|---|---|---|---|---|
| Labour | Dave Baigent | 1,461 | 59.3 | +9.6 | |
| Liberal Democrats | Joshua Guy Blanchard Lewis | 563 | 22.9 | -12.9 | |
| Green | Caitlin Ruth Patterson | 269 | 10.9 | +1.3 | |
| Conservative | Martin Keegan | 170 | 6.9 | +2.0 | |
| Turnout | 2,463 | ||||
| Labour hold | Swing | ||||
Trumpington
| Party | Candidate | Votes | % | ±% | |
|---|---|---|---|---|---|
| Labour | Katie Thornburrow | 1,302 | 37.7 | +12.0 | |
| Liberal Democrats | Dan Hilken | 1,298 | 37.6 | -3.7 | |
| Conservative | Philip James Salway | 561 | 16.2 | -6.4 | |
| Green | Ceri Barbara Galloway | 293 | 8.5 | -1.9 | |
| Turnout | 3,454 | ||||
| Labour gain from Liberal Democrats | Swing | ||||
West Chesterton
| Party | Candidate | Votes | % | ±% | |
|---|---|---|---|---|---|
| Liberal Democrats | Jamie Dalzell | 1,349 | 44.2 | +6.1 | |
| Labour | Clare Frances King | 1228 | 40.2 | -6.5 | |
| Conservative | Michael John Harford | 275 | 9.0 | +3.0 | |
| Green | Shayne Mary Mitchell | 203 | 6.6 | +0.1 | |
| Turnout | 3,055 | ||||
| Liberal Democrats hold | Swing | ||||
References
- "Cambridge City Council Election Results 2018". Cambridge Elections. Retrieved 4 May 2018.
- Thomas, Josh (4 May 2018). "Cambridge election results: This is how the city voted". cambridgenews. Retrieved 28 April 2019.
| Cambridgeshire County Council | |
|---|---|
| Peterborough City Council | |
| Cambridge City Council | |
| East Cambridgeshire District Council | |
| Fenland District Council | |
| Huntingdonshire District Council | |
| South Cambridgeshire District Council | |
| Isle of Ely County Council |
|
| Huntingdon & Peterborough County Council |
|
| Mayor of Cambridgeshire and Peterborough | |
| |
This article is issued from Wikipedia. The text is licensed under Creative Commons - Attribution - Sharealike. Additional terms may apply for the media files.