List of Louisiana parishes by French-speaking population
The list of Louisiana parishes by French-speaking population was created from the 2000 Census of the United States.[1] Census collects data on languages spoken at home by inhabitants of Louisiana five years of age or more. Responses "French" and "Cajun" are included.
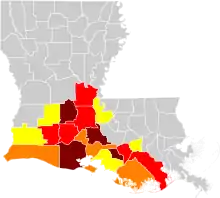
French spread in Louisiana. Parishes marked in yellow are those where 4–10% of the population speak French or Cajun French at home, orange 10–15%, red 15–20%, brown 20–30%.
Statewide, out of a population 5 years and older of 4,152,122, some 179,750 people reported French as their home language, while 14,365 reported "Cajun". A further 4,465 who reported French Creole are not counted below.
According to the 2010 US Census, there was a huge decline in the number of French speakers in Louisiana. It now stands at 115,183 which equates to 2.8% of the state population.[2]
Complete Parish listing
| Name of parish | Total population 5 and older 2000 | French-speaking population 5 and older 2000 | Percentage French-speaking 2000 | French-speaking population 5 and older 2010 | Percentage French-speaking 2010 | Map |
|---|---|---|---|---|---|---|
| Lafayette[lower-alpha 1] | 176,051 | 25,300 | 14.37% | 20,769 | 10% | 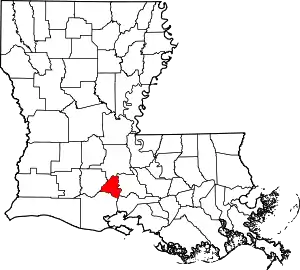 |
| Lafourche[lower-alpha 2] | 83,518 | 15,984 | 19.12% | 13,525 | 15% | 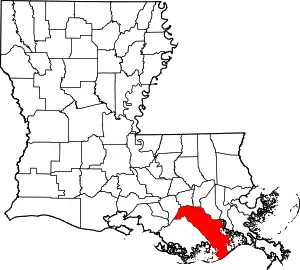 |
| St. Landry[lower-alpha 1] | 80,668 | 13,475 | 16.70% | 7,841 | 10.08% |  |
| Vermilion[lower-alpha 1] | 49,842 | 12,410 | 24.89% | 9,766 | 18% | 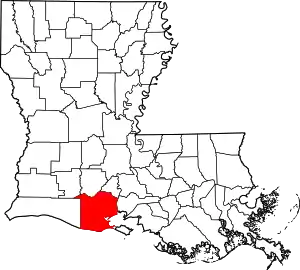 |
| St. Martin[lower-alpha 1] | 44,779 | 12,290 | 27.44% | 8,675 | 18% |  |
| Acadia[lower-alpha 1] | 54,114 | 10,310 | 19.04% | 8,088 | 14% | 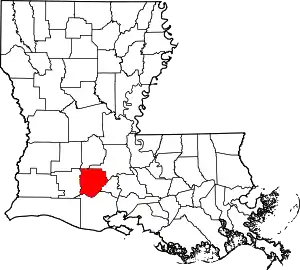 |
| Terrebonne[lower-alpha 2] | 96,309 | 10,275 | 10.66% | 7,873 | 7.65% | 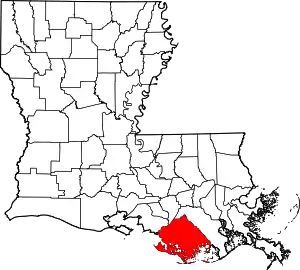 |
| Calcasieu[lower-alpha 2] | 169,745 | 10,170 | 5.98% | 7,292 | 4.15% |  |
| Evangeline[lower-alpha 1] | 32,454 | 8,345 | 25.71% | 5,740 | 18% | 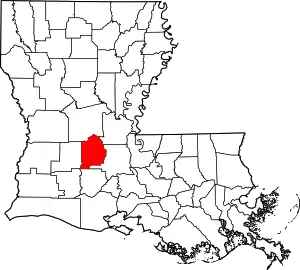 |
| Iberia[lower-alpha 1] | 67,374 | 8,089 | 11.99% | 5,666 | 8.35% | 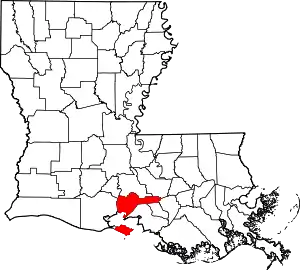 |
| East Baton Rouge | 382,741 | 7,925 | 2.07% | 4,195 | 4% | 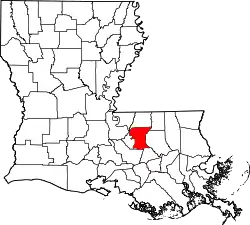 |
| Jefferson[lower-alpha 2] | 424,600 | 7,763 | 1.82% | 4,165 | 1% | 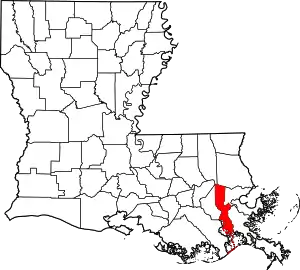 |
| Avoyelles[lower-alpha 2] | 38,468 | 6,789 | 17.64% | 4,331 | 11.07% | 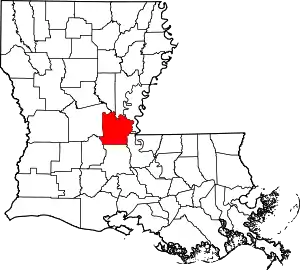 |
| Orleans | 450,894 | 5,805 | 1.28% |  | ||
| Jefferson Davis | 28,844 | 4,660 | 16.15% | 3,223 | 11.07% | 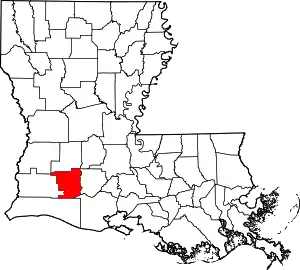 |
| Assumption[lower-alpha 2] | 21,713 | 3,819 | 17.58% | 2,676 | 12.15% |  |
| St. Mary[lower-alpha 1] | 49,345 | 2,685 | 5.43% |  | ||
| Rapides | 116,866 | 2,189 | 1.86% |  | ||
| St. Tammany | 177,092 | 2,160 | 1.21% | 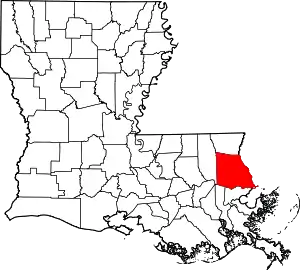 | ||
| Ascension[lower-alpha 2] | 70,093 | 1,944 | 2.76% | 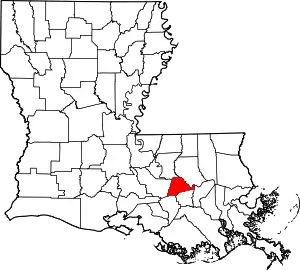 | ||
| Caddo | 233,812 | 1,944 | 0.82% | 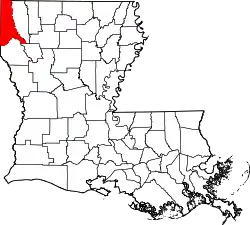 | ||
| Allen | 23,571 | 1,468 | 6.22% | 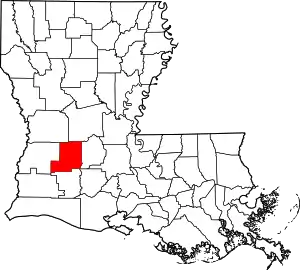 | ||
| Livingston | 84,694 | 1,344 | 1.58% | 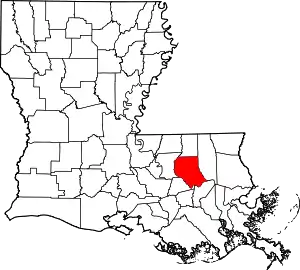 | ||
| St. Charles[lower-alpha 2] | 44,152 | 1,189 | 2.69% | 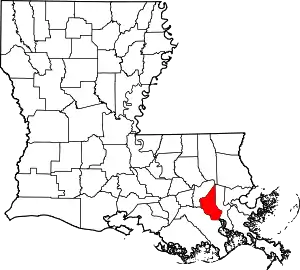 | ||
| Tangipahoa | 93,002 | 1,084 | 1.16% | 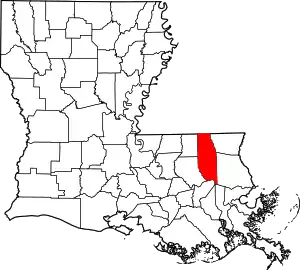 | ||
| Cameron[lower-alpha 2] | 9,279 | 1,075 | 11.57% | 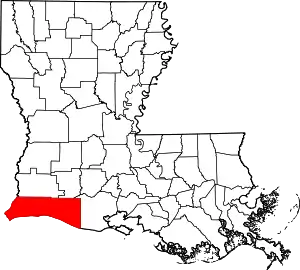 | ||
| Pointe Coupee[lower-alpha 2] | 21,139 | 1,035 | 4.89% |  | ||
| Ouachita | 136,264 | 1,030 | 0.75% |  | ||
| Iberville[lower-alpha 2] | 31,035 | 1,005 | 3.23% |  | ||
| St. James[lower-alpha 2] | 19,684 | 980 | 4.97% |  | ||
| St. Bernard | 62,812 | 915 | 1.44% |  | ||
| Plaquemines | 24,581 | 855 | 3.47% | 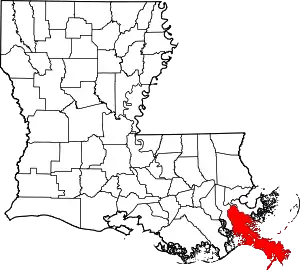 | ||
| St. John the Baptist[lower-alpha 2] | 39,220 | 735 | 1.86% | 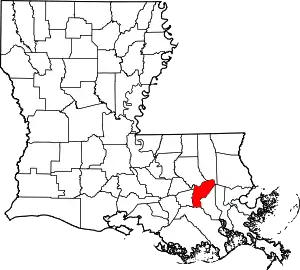 | ||
| West Baton Rouge[lower-alpha 2] | 20,012 | 675 | 3.36% | 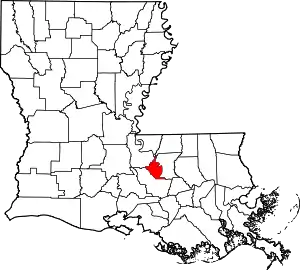 | ||
| East Feliciana | 19,853 | 574 | 2.88% |  | ||
| Beauregard | 30,559 | 570 | 1.86% | 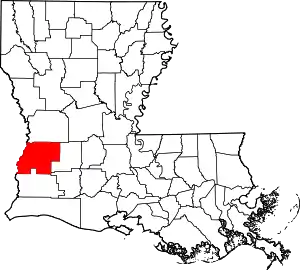 | ||
| Lincoln | 39,573 | 510 | 1.28% |  | ||
| Bossier | 90,587 | 474 | 0.51% |  | ||
| Washington | 40,738 | 364 | 0.89% |  | ||
| Vernon | 47,048 | 350 | 0.74% |  | ||
| Natchitoches | 36,082 | 339 | 0.93% |  | ||
| Webster | 39,110 | 243 | 0.62% |  | ||
| Grant | 17,223 | 230 | 1.32% |  | ||
| De Soto | 23,607 | 230 | 0.97% |  | ||
| Concordia | 18,698 | 190 | 1.01% |  | ||
| Sabine | 21,830 | 190 | 0.86% |  | ||
| La Salle | 13,281 | 167 | 1.25% |  | ||
| West Feliciana | 14,338 | 159 | 1.10% |  | ||
| Jackson | 14,363 | 148 | 1.03% |  | ||
| Richland | 19,319 | 100 | 0.51% |  | ||
| Catahoula | 10,183 | 99 | 0.97% |  | ||
| Union | 21,129 | 95 | 0.44% |  | ||
| West Carroll | 11,507 | 83 | 0.72% |  | ||
| Caldwell | 9,868 | 79 | 0.80% |  | ||
| Bienville | 14,699 | 79 | 0.53% |  | ||
| Franklin | 19,649 | 79 | 0.40% |  | ||
| Morehouse | 28,735 | 75 | 0.26% |  | ||
| Winn | 15,783 | 64 | 0.40% |  | ||
| East Carroll | 8,585 | 55 | 0.64% |  | ||
| Tensas | 6,144 | 35 | 0.56% |  | ||
| Claiborne | 15,794 | 35 | 0.22% |  | ||
| St. Helena | 9,690 | 30 | 0.30% |  | ||
| Madison | 12,555 | 25 | 0.19% |  | ||
| Red River | 8,854 | 20 | 0.22% |  | ||
| Louisiana total | 4,152,122 | 194,115 | 4.66% | 115,183 | 2.8% | |
See also
- French language in the Americas
Notes
- Parishes of Cajun Heartland
- Other parishes of Acadiana
References
- "Language Map Data Center". Retrieved 2010-03-02.
- "Archived copy". Archived from the original on 2006-06-19. Retrieved 2007-10-22.CS1 maint: archived copy as title (link)
- "Archived copy". Archived from the original on 2013-08-15. Retrieved 2013-08-06.CS1 maint: archived copy as title (link)
This article is issued from Wikipedia. The text is licensed under Creative Commons - Attribution - Sharealike. Additional terms may apply for the media files.