List of cities in the Americas by population
The following is a list of the 100 largest cities in the Americas by city proper population using the most recent official estimate.[1][2]
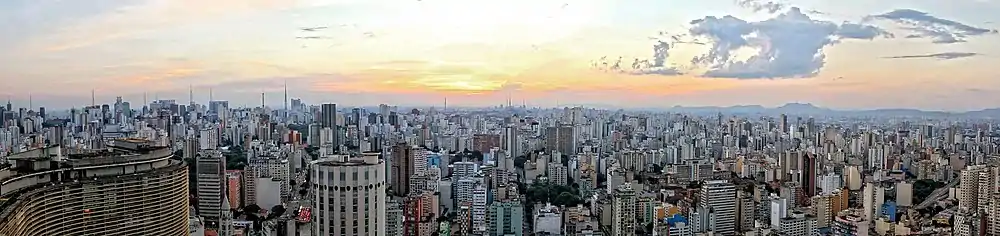
São Paulo in Brazil is the most populous city in the Americas, the western hemisphere and also the southern hemisphere.
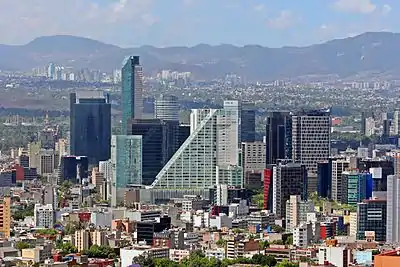
Skyline of Mexico City, the largest city in North America.

New York, the largest city of the United States and a global economic hub.

A major tourist destination, Rio de Janeiro is Brazil's second biggest city by population.


Skyline of Los Angeles, the second-largest city in the United States third-largest city in North America.

Buenos Aires, the capital of Argentina and the ninth most populous city in the Americas, also located in the center of a metropolitan area home to about 13 million people.


Downtown Toronto, the largest city in Canada located at the heart of a metropolitan area with a population of over 6.4 million.

List
Italics represents capital city
Bold represents largest city in country
| Rank | City | Country | Population | Population as of |
|---|---|---|---|---|
| 1 | São Paulo | 12,141,890 | 2019 | |
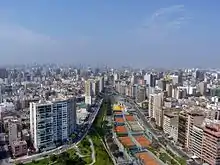
| 2 | Lima | 9,674,755 [note 1] | 2020 | |
| 3 | Mexico City | 9,031,200 [note 2] | 2019 | |
| 4 | New York | 8,398,748 | 2018 | |
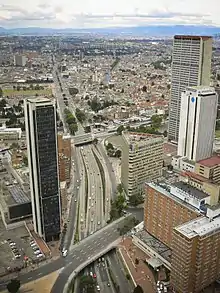
| 5 | Bogotá | 8,064,000 | 2017 | |
| 6 | Rio de Janeiro | 6,718,900 | 2019 | |
| 7 | Santiago | 6,160,040 | 2017 | |
| 8 | Los Angeles | 3,990,456 | 2018 | |
| 9 | Buenos Aires | 3,072,029 | 2019 | |
| 10 | Brasília | 2,912,090 | 2019 | |
| 11 | Salvador | 2,871,560 | 2019 | |
| 12 | Toronto | 2,731,571 [note 3] | 2016 | |
| 13 | Chicago | 2,705,994 | 2018 | |
| 14 | Fortaleza | 2,669,340 | 2019 | |
| 15 | Santo Domingo | 2,581,827 | 2010 | |
| 16 | Belo Horizonte | 2,512,070 | 2019 | |
| 17 | Medellín | 2,480,000 | 2017 | |
| 18 | Cali | 2,383,500 | 2017 | |
| 19 | Houston | 2,325,502 | 2018 | |
| 20 | Guayaquil | 2,278,691 | 2010 | |
| 21 | Manaus | 2,171,700 | 2019 | |
| 22 | Havana | 2,131,480 | 2018 | |
| 23 | Caracas | 2,089,012 | 2019 | |
| 24 | Curitiba | 1,933,110 | 2019 | |
| 25 | Ecatepec | 1,837,700 | 2019 | |
| 26 | Maracaibo | 1,752,602 [note 4] | 2019 | |
| 27 | Montreal | 1,704,694 [note 5] | 2016 | |
| 28 | Phoenix | 1,660,272 | 2018 | |
| 29 | Recife | 1,645,730 | 2019 | |
| 30 | Quito | 1,607,734 | 2010 | |
| 31 | Philadelphia | 1,584,138 | 2018 | |
| 32 | Puebla | 1,544,500 | 2019 | |
| 33 | Guadalajara | 1,539,900 | 2019 | |
| 34 | San Antonio | 1,532,233 | 2018 | |
| 35 | Goiânia | 1,510,380 | 2019 | |
| 36 | Porto Alegre | 1,483,770 | 2019 | |
| 37 | Belém | 1,479,970 | 2019 | |
| 38 | Ciudad Juárez | 1,460,200 | 2019 | |
| 39 | Córdoba | 1,446,201 | 2019 | |
| 40 | Tijuana | 1,445,100 | 2019 | |
| 41 | Santa Cruz | 1,442,396 | 2012 | |
| 42 | San Diego | 1,425,976 | 2018 | |
| 43 | Guarulhos | 1,379,180 | 2019 | |
| 44 | Dallas | 1,345,047 | 2018 | |
| 45 | Montevideo | 1,304,687 | 2019 | |
| 46 | León | 1,288,600 | 2019 | |
| 47 | Rosario | 1,284,166 | 2019 | |
| 48 | Zapopan | 1,251,300 | 2019 | |
| 49 | Calgary | 1,239,220 [note 3] | 2016 | |
| 50 | Monterrey | 1,228,000 | 2019 | |
| 51 | Barranquilla | 1,224,000 | 2017 | |
| 52 | Nezahualcóyotl | 1,213,200 | 2019 | |
| 53 | Campinas | 1,183,370 | 2019 | |
| 54 | Barquisimeto | 1,089,100 | 2019 | |
| 55 | São Gonçalo | 1,084,050 | 2019 | |
| 56 | Tegucigalpa | 1,079,400 | 2019 | |
| 57 | São Luís | 1,040,740 | 2019 | |
| 58 | Managua | 1,038,785 | 2018 | |
| 59 | San Jose | 1,030,119 | 2018 | |
| 60 | Maceió | 1,018,270 | 2019 | |
| 61 | Arequipa | 1,002,846 | 2017 | |
| 62 | Naucalpan | 998,000 | 2019 | |
| 63 | Cartagena | 983,400 | 2017 | |
| 64 | Austin | 964,254 | 2018 | |
| 65 | Valencia | 936,071 [note 6] | 2019 | |
| 66 | Ottawa | 934,243 [note 3] | 2016 | |
| 67 | Chihuahua | 932,600 | 2019 | |
| 68 | Edmonton | 932,546[note 3] | 2016 | |
| 69 | Guatemala City | 923,392 | 2018 | |
| 70 | Duque de Caxias | 916,470 | 2019 | |
| 71 | Jacksonville | 903,889 | 2018 | |
| 72 | Fort Worth | 895,008 | 2018 | |
| 73 | Ciudad Guayana | 893,400 | 2019 | |
| 74 | Columbus | 892,533 | 2018 | |
| 75 | Natal | 884,120 | 2019 | |
| 76 | Campo Grande | 883,960 | 2019 | |
| 77 | San Francisco | 883,305 | 2018 | |
| 78 | Port-au-Prince | 875,978 | 2009 | |
| 79 | Charlotte | 872,498 | 2018 | |
| 80 | Mérida | 872,300 | 2019 | |
| 81 | Indianapolis | 867,125 | 2018 | |
| 82 | Trujillo | 857,063 | 2017 | |
| 83 | El Alto | 846,880 | 2012 | |
| 84 | Hermosillo | 829,000 | 2019 | |
| 85 | Cancún | 827,500 | 2019 | |
| 86 | São Bernardo do Campo | 824,900 | 2019 | |
| 87 | Teresina | 815,270 | 2019 | |
| 88 | Nova Iguaçu | 812,160 | 2019 | |
| 89 | Saltillo | 811,500 | 2019 | |
| 90 | João Pessoa | 805,960 | 2019 | |
| 91 | Aguascalientes | 805,200 | 2019 | |
| 92 | Culiacán | 795,000 | 2019 | |
| 93 | San Luis Potosí | 793,300 | 2019 | |
| 94 | La Paz | 758,845 | 2012 | |
| 95 | Mexicali | 757,200 | 2019 | |
| 96 | Chimalhuacán | 752,200 | 2019 | |
| 97 | Seattle | 744,955 | 2018 | |
| 98 | Guadalupe | 722,400 | 2019 | |
| 99 | Acapulco | 720,400 | 2019 | |
| 100 | Denver | 716,492 | 2018 | |
See also
Notes
- Region of Lima, not including metropolitan area extending into neighbouring regions
- Mexico City Federal District
- Municipality only
- Excluding municipality of San Francisco: included in the metropolitan city of Maracaibo
- Ville (municipality) only
- Municipality only - excluding Los Guayos, Naguanagua, San Diego and Tocuyito
References
- "America: Population Statistics in Maps and Charts for Cities, Agglomerations and Administrative Divisions of all Countries in America". www.citypopulation.de.
- "For Canada only". en.wikipedia.org/wiki/List_of_the_100_largest_municipalities_in_Canada_by_population.
This article is issued from Wikipedia. The text is licensed under Creative Commons - Attribution - Sharealike. Additional terms may apply for the media files.