List of countries by current account balance
This is a list of countries by current account balance.
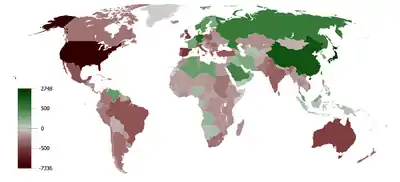
Cumulative Current Account Balance 1980–2008 based on the IMF data)
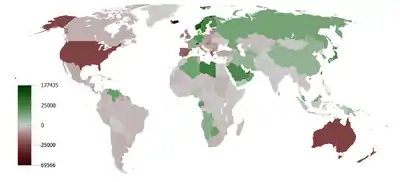
Cumulative Current Account Balance per capita 1980–2008 based on the IMF
CIA World Factbook data
Top 18 economies with the largest surplus
This is a list of the 18 countries and territories with the largest surplus in current account balance (CAB), based on data from 2017 est. as listed in the CIA World Factbook.[1]
| Rank | Economy | CAB (million US dollars) | Year |
|---|---|---|---|
| 1 | 296,600 | 2017 EST. | |
| 2 | 195,400 | 2017 EST. | |
| 3 | 164,900 | 2017 EST. | |
| 4 | 80,880 | 2017 EST. | |
| 5 | 78,460 | 2017 EST. | |
| 6 | 68,823 | 2019 EST. | |
| 7 | 60,990 | 2017 EST. | |
| 8 | 56,070 | 2017 EST. | |
| 9 | 49,280 | 2017 EST. | |
| 10 | 41,880 | 2017 EST. | |
| 11 | 40,250 | 2017 EST. | |
| 12 | 24,600 | 2017 EST. | |
| 13 | 21,700 | 2017 EST. | |
| 14 | 20,340 | 2017 EST. | |
| 15 | 18,400 | 2017 EST. | |
| 16 | 18,230 | 2017 EST. | |
| 17 | 17,630 | 2017 EST. | |
| 18 | 17,010 | 2017 EST. | |
Top 20 countries with the largest deficit
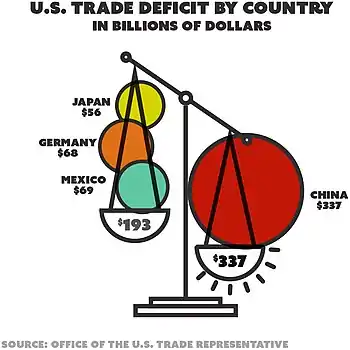
U.S. trade deficit (in billions, goods and services) by country in 2017
This is a list of the 20 countries and territories with the largest deficit in current account balance (CAB), based on data from 2017 est. as listed in the CIA World Factbook.[1]
| Rank | Country | CAB (Billion US dollars) | Year |
|---|---|---|---|
| 1 | -466,200 | 2017 EST. | |
| 2 | -106,700 | 2019 Q3 Only [2] | |
| 3 | -87,200 | 2018-19 EST.[3] | |
| 4 | -49,260 | 2017 EST. | |
| 5 | -47,100 | 2017 EST. | |
| 6 | -36,770 | 2017 EST. | |
| 7 | -32,270 | 2017 EST. | |
| 8 | -30,790 | 2017 EST. | |
| 9 | -21,940 | 2017 EST. | |
| 10 | -18,830 | 2017 EST. | |
| 11 | -17,290 | 2017 EST. | |
| 12 | -15,380 | 2017 EST. | |
| 13 | -12,880 | 2017 EST. | |
| 14 | -6,551 | 2017 EST. | |
| 15 | -10,360 | 2017 EST. | |
| 16 | -9,762 | 2017 EST. | |
| 17 | -8,557 | 2017 EST. | |
| 18 | -7,912 | 2017 EST. | |
| 19 | -7,298 | 2017 EST. |
Eurostat data
This table shows the account balance of both the Euro Area and the European Union as a whole, according to data from Eurostat (in EUR).[4]
| Rank | Country | CAB (million Euros) | Year |
|---|---|---|---|
| 1 | 386,567 | 2017 | |
| 2 | 201,910 | 2017 | |
References
- "The World Factbook — Central Intelligence Agency". www.cia.gov.
- "United Kingdom Current Account Balance | Moody's Analytics". www.economy.com.
- "FY19 CAD inches up to 2.1%, but more than halves in Q4: RBI". India Today. June 28, 2019.
- "Eurostat - Tables, Graphs and Maps Interface (TGM) table". ec.europa.eu.
This article is issued from Wikipedia. The text is licensed under Creative Commons - Attribution - Sharealike. Additional terms may apply for the media files.