Ogmore (Senedd Cymru constituency)
Ogmore (Welsh: Ogwr) is a constituency of the Senedd. It elects one Member of the Senedd by the first past the post method of election. It is one of seven constituencies in the South Wales West electoral region, which also elects four additional members, to produce a degree of proportional representation for the region as a whole.
| Ogmore (Welsh: Ogwr) | |
|---|---|
| Senedd Cymru county constituency | |
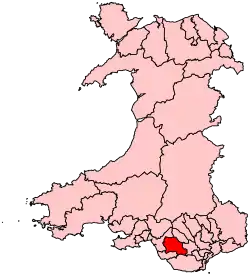 Ogmore shown as one of the 40 Senedd constituencies | |
| Current Senedd Cymru county constituency | |
| Created | 1999 |
| Party | Labour |
| MS | Huw Irranca-Davies |
| Electoral region | South Wales West |
| Preserved county | Mid Glamorgan and South Glamorgan |
Boundaries
The constituency was created for the first election to the Assembly, in 1999, with the name and boundaries of the Ogmore Westminster constituency. It is almost entirely within the preserved county of Mid Glamorgan, but takes in a very small area in South Glamorgan. It covers the area of Bridgend County Borough Council roughly north of the M4, and parts of Rhondda Cynon Taf County Borough Council. It includes the communities of Cefn Cribwr, Garw Valley, Gilfach Goch, Llanharan, Maesteg, Ogwr Valley, Pencoed, Sarn and Tondu.[1]
The other six constituencies of the region are Aberavon, Bridgend, Gower, Neath, Swansea East and Swansea West.
Voting
In general elections for the Senedd, each voter has two votes. The first vote may be used to vote for a candidate to become the Member of the Senedd for the voter's constituency, elected by the first past the post system. The second vote may be used to vote for a regional closed party list of candidates. Additional member seats are allocated from the lists by the d'Hondt method, with constituency results being taken into account in the allocation.
Assembly members and Members of the Senedd
| Election | Member | Party | Portrait | |
|---|---|---|---|---|
| 1999 | Janice Gregory | Labour Party |  | |
| 2016 | Huw Irranca-Davies | Labour Party |  | |
Elections
Elections in the 2010s
| Party | Candidate | Votes | % | ±% | |
|---|---|---|---|---|---|
| Labour | Huw Irranca-Davies | 12,895 | 55.2 | -8.7 | |
| Plaid Cymru | Tim Thomas | 3,427 | 14.7 | -2.0 | |
| UKIP | Elizabeth Kendall | 3,233 | 13.8 | +13.8 | |
| Conservative | Jamie Wallis | 2,587 | 11.1 | -3.5 | |
| Liberal Democrats | Anita Davies | 698 | 3.0 | -1.9 | |
| Green | Laurie Brophy | 516 | 2.2 | +2.2 | |
| Majority | 9,468 | 40.5 | -6.8 | ||
| Turnout | 42.9 | +6.5 | |||
| Party | Candidate | Votes | % | ±% | |
|---|---|---|---|---|---|
| Labour | Janice Gregory | 12,995 | 63.9 | +12.3 | |
| Plaid Cymru | Danny Clark | 3,379 | 16.7 | −0.3 | |
| Conservative | Martyn Hughes | 2,945 | 14.5 | +2.8 | |
| Liberal Democrats | Gerald Francis | 985 | 4.9 | −4.6 | |
| Majority | 9,576 | 47.3 | +12.6 | ||
| Turnout | 20,264 | 36.4 | −3.6 | ||
| Labour hold | Swing | +6.3 | |||
Elections in the 2000s
| Party | Candidate | Votes | % | ±% | |
|---|---|---|---|---|---|
| Labour | Janice Gregory | 11,761 | 51.7 | −7.2 | |
| Plaid Cymru | Sian M. Caiach | 3,861 | 17.0 | −3.1 | |
| Conservative | Norma Lloyd-Nesling | 2,663 | 11.7 | +2.6 | |
| Independent | Steve B. Smith | 2,337 | 10.3 | N/A | |
| Liberal Democrats | Martin Plant | 2,144 | 9.4 | +0.0 | |
| Majority | 7,900 | 34.7 | -4.1 | ||
| Turnout | 22,766 | 40.0 | +6.5 | ||
| Labour hold | Swing | −2.1 | |||
| Party | Candidate | Votes | % | ±% | |
|---|---|---|---|---|---|
| Labour | Janice Gregory | 9,874 | 58.9 | +10.7 | |
| Plaid Cymru | Janet Davies | 3,370 | 20.1 | −7.0 | |
| Liberal Democrats | Jacqueline Radford | 1,567 | 9.4 | +2.5 | |
| Conservative | Richard J. Hill | 1,532 | 9.1 | +2.5 | |
| Socialist Labour | Christopher Herriott | 410 | 2.5 | N/A | |
| Majority | 6,504 | 38.8 | +18.7 | ||
| Turnout | 16,753 | 33.5 | −8.0 | ||
| Labour hold | Swing | +8.9 | |||
Elections in the 1990s
| Party | Candidate | Votes | % | ±% | |
|---|---|---|---|---|---|
| Labour | Janice Gregory | 10,407 | 48.2 | N/A | |
| Plaid Cymru | John D. Rogers | 5,842 | 27.1 | N/A | |
| Independent | Ralph G. Hughes | 2,439 | 11.3 | N/A | |
| Liberal Democrats | Sheila Ramsay-Waye | 1,496 | 6.9 | N/A | |
| Conservative | Chris B. Smart | 1,415 | 6.6 | N/A | |
| Majority | 4,565 | 21.1 | N/A | ||
| Turnout | 21,599 | 41.5 | N/A | ||
| Labour win (new seat) | |||||
References
- "Ogmore Constituency Labour Party". Ogmore Labour. 20 July 2008. Archived from the original on 3 June 2016. Retrieved 28 August 2008.
- "Wales elections > Ogmore". BBC News. 6 May 2016. Retrieved 8 March 2016.
- "Wales elections > Ogmore". BBC News. 6 May 2011. Retrieved 8 March 2011.
- Election results – 2007 Archived 9 May 2011 at the Wayback Machine, National Assembly for Wales
- Ogmore, Political Science Resources