1991 Derby City Council election
The 1991 Derby City Council election took place on 2 May 1991 to elect members of Derby City Council in England. Local elections were held in the United Kingdom in 1991.[3] This was on the same day as other local elections. 15 of the council's 44 seats were up for election. The council, which had previously been under Conservative council, fell under no overall control with the Conservatives and Labour holding exactly half the seats each.
| |||||||||||||||||||||||||
15 of the 44 seats in the Derby City Council 23 seats needed for a majority | |||||||||||||||||||||||||
|---|---|---|---|---|---|---|---|---|---|---|---|---|---|---|---|---|---|---|---|---|---|---|---|---|---|
| |||||||||||||||||||||||||
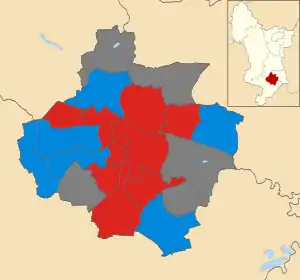 Map showing the results of the 1991 Derby City Council elections. | |||||||||||||||||||||||||
| |||||||||||||||||||||||||
Overall results
| Party | Seats | Gains | Losses | Net gain/loss | Seats % | Votes % | Votes | +/− | |
|---|---|---|---|---|---|---|---|---|---|
| Labour | 9 | 2 | 0 | 60.0 | 42.6 | 23,820 | |||
| Conservative | 6 | 0 | 2 | 40.0 | 43.9 | 24,523 | |||
| Liberal Democrats | 0 | 0 | 0 | 0.0 | 11.6 | 6,478 | |||
| Green | 0 | 0 | 0 | 0.0 | 1.9 | 1,086 | |||
| Total | 15 | 55,907 | |||||||
Ward results
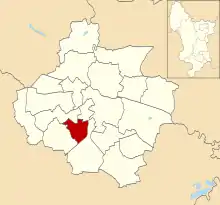
Abbey
Location of Abbey ward
| Party | Candidate | Votes | % | |
|---|---|---|---|---|
| Labour | M. Ainsley | 2,054 | 55.0% | |
| Conservative | G. Shaw | 1,267 | 33.9% | |
| Liberal Democrats | G. Wood | 279 | 7.5% | |
| Green | P. Brock | 136 | 3.6% | |
| Turnout | 40.9% | |||
| Labour hold | ||||
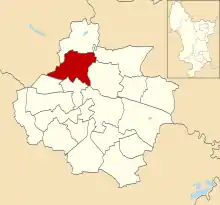
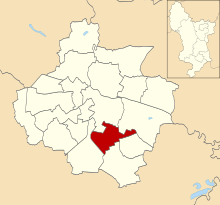
Babington
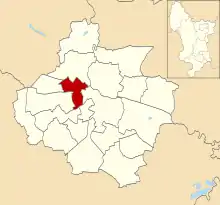
Location of Babington ward
| Party | Candidate | Votes | % | |
|---|---|---|---|---|
| Labour | F. Hussain | 1,596 | 58.8% | |
| Liberal Democrats (UK) | M. Burgess | 505 | 18.6% | |
| Conservative | M. Ali | 489 | 18.0% | |
| Green | B. Emmans | 122 | 4.5% | |
| Turnout | 36.3% | |||
| Labour hold | ||||
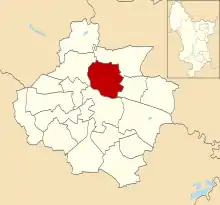
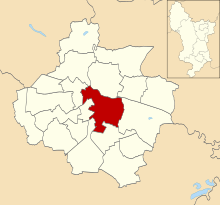
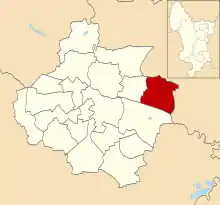
Chaddesden
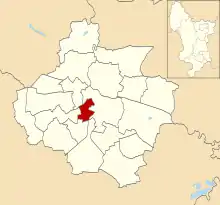
Location of Chaddesden ward
| Party | Candidate | Votes | % | |
|---|---|---|---|---|
| Labour | J. Till | 2,209 | 48.7% | |
| Conservative | H. Johnson | 1,857 | 40.9% | |
| Liberal Democrats (UK) | D. Smith | 474 | 10.4% | |
| Turnout | 53.0% | |||
| Labour gain from Conservative | ||||
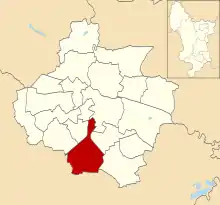
Chellaston
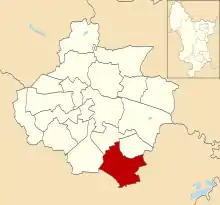
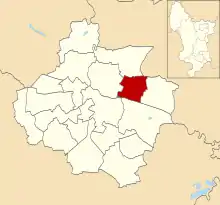
Location of Chellaston ward
| Party | Candidate | Votes | % | |
|---|---|---|---|---|
| Conservative | J. Jennings | 2,893 | 60.6% | |
| Labour | H. Gorham | 1,321 | 27.7% | |
| Liberal Democrats | A. Hartropp | 417 | 8.7% | |
| Green | C. Cooper | 140 | 2.9% | |
| Turnout | 49.2% | |||
| Conservative hold | ||||
Darley
Location of Darley ward
| Party | Candidate | Votes | % | |
|---|---|---|---|---|
| Conservative | P. Hickson | 2,826 | 57.6% | |
| Labour | J. Gilmore | 1,298 | 26.5% | |
| Liberal Democrats | W. Webley | 692 | 14.1% | |
| Green | L. Ludkiewicz | 88 | 1.8% | |
| Turnout | 52.6% | |||
| Conservative hold | ||||
Derwent
Location of Derwent ward
| Party | Candidate | Votes | % | |
|---|---|---|---|---|
| Labour | D. Hayes | 1,784 | 59.1% | |
| Conservative | J. Ormond | 863 | 28.6% | |
| Liberal Democrats | M. McCann | 308 | 10.2% | |
| Green | I. Sandars | 64 | 2.1% | |
| Turnout | 40.1% | |||
| Labour hold | ||||
Kingsway
Location of Kingsway ward
| Party | Candidate | Votes | % | |
|---|---|---|---|---|
| Conservative | M. Bertalan | 2,171 | 59.1% | |
| Labour | K. Hepworth | 1,017 | 27.7% | |
| Liberal Democrats | A. Spendlove | 486 | 13.2% | |
| Turnout | 48.1% | |||
| Conservative hold | ||||
Litchurch
Location of Litchurch ward
| Party | Candidate | Votes | % | |
|---|---|---|---|---|
| Labour | J. McGiven | 1,744 | 64.8% | |
| Conservative | M. Najeeb | 614 | 22.8% | |
| Liberal Democrats | C. Harris | 196 | 7.3% | |
| Green | L. Davies | 139 | 5.2% | |
| Turnout | 36.7% | |||
| Labour hold | ||||
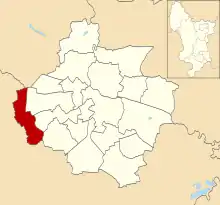
Littleover
Location of Littleover ward
| Party | Candidate | Votes | % | |
|---|---|---|---|---|
| Conservative | R. Wood | 1,918 | 47.3% | |
| Liberal Democrats | L. Care | 1,060 | 26.2% | |
| Labour | J. Green | 1,006 | 24.8% | |
| Green | M. Attenborrow | 67 | 1.7% | |
| Turnout | 56.4% | |||
| Conservative hold | ||||
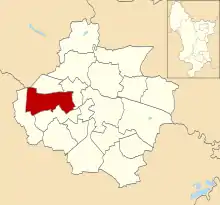
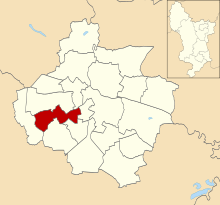
Mackworth
Location of Mackworth ward
| Party | Candidate | Votes | % | |
|---|---|---|---|---|
| Labour | G. Summers | 1,929 | 55.7% | |
| Conservative | A. Clemson | 1,242 | 35.8% | |
| Liberal Democrats | S. Hartropp | 294 | 8.5% | |
| Turnout | 50.6% | |||
| Labour gain from Conservative | ||||
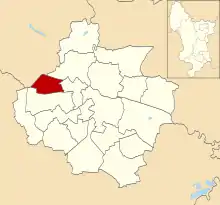
Mickleover
Location of Mickleover ward
| Party | Candidate | Votes | % | |
|---|---|---|---|---|
| Conservative | R. Broadfield | 2,710 | 62.5% | |
| Labour | A. Macdonald | 922 | 21.3% | |
| Liberal Democrats | D. Turner | 573 | 13.2% | |
| Green | C. Jones | 128 | 3.0% | |
| Turnout | 51.5% | |||
| Conservative hold | ||||
Normanton
Location of Normanton ward
| Party | Candidate | Votes | % | |
|---|---|---|---|---|
| Labour | Chris Williamson | 1,810 | 55.1% | |
| Conservative | K. Webley | 1,104 | 33.6% | |
| Liberal Democrats | L. Jones | 285 | 8.7% | |
| Green | E. Wall | 83 | 2.5% | |
| Turnout | 44.0% | |||
| Labour hold | ||||
Osmanton
Location of Osmaston ward
| Party | Candidate | Votes | % | |
|---|---|---|---|---|
| Labour | M. Streets | 1,254 | 64.8% | |
| Conservative | D. Brown | 479 | 24.8% | |
| Liberal Democrats | A. Todd | 201 | 10.4% | |
| Turnout | 31.8% | |||
| Labour hold | ||||
Sinfin
Location of Sinfin ward
| Party | Candidate | Votes | % | |
|---|---|---|---|---|
| Labour | A. Mullarkey | 1,960 | 63.7% | |
| Conservative | C. Hateley | 822 | 26.7% | |
| Liberal Democrats | E. Blane | 295 | 9.6% | |
| Turnout | 40.9% | |||
| Labour hold | ||||
Spondon
Location of Spondon ward
| Party | Candidate | Votes | % | |
|---|---|---|---|---|
| Conservative | C. Brown | 3,268 | 57.2% | |
| Labour | K. Merry | 1,916 | 33.5% | |
| Liberal Democrats | D. Holebrook | 413 | 7.2% | |
| Green | P. Chapman | 119 | 2.1% | |
| Turnout | 55.8% | |||
| Conservative hold | ||||
References
- "Council compositions by year". The Elections Centre.
- "Local Election Summaries 1991". The Elections Centre.
- Rallings, Colin; Thrasher, Michael. Local Elections Handbook 1991 (PDF). The Elections Centre. Retrieved 21 February 2020.
- "Derby City Council Election Results 1979-1995" (PDF). Elections Centre.
| Metropolitan boroughs |
|
|---|---|
| District councils (England) |
|
| District councils (Wales) |
|
This article is issued from Wikipedia. The text is licensed under Creative Commons - Attribution - Sharealike. Additional terms may apply for the media files.