2018 Amber Valley Borough Council election
Elections to Amber Valley Borough Council in Derbyshire, England took place on Thursday 3 May 2018. One third of the council seats were up for election.[1]
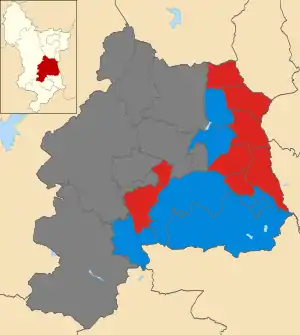
Map of the results of the 2018 Amber Valley Borough council election. Labour in red and Conservatives in blue. Wards in grey were not contested in 2018.
The Conservatives gained seats to strengthen their position controlling the council. After the election, the composition of the council was:-
- Conservative 25
- Labour 20
Election result
| Party | Seats | Gains | Losses | Net gain/loss | Seats % | Votes % | Votes | +/− | |
|---|---|---|---|---|---|---|---|---|---|
| Conservative | 7 | +3 | -1 | +2 | 46.7% | 47.2% | 11723 | ||
| Labour | 8 | +1 | -3 | -2 | 53.3% | 41.9% | 10417 | ||
| Green | 0 | 0 | 0 | 0 | 0% | 5.8% | 1440 | ||
| Liberal Democrats | 0 | 0 | 0 | 0 | 0% | 4.8% | 1182 | ||
| Independent | 0 | 0 | 0 | 0 | 0% | 0.3% | 71 | ||
| National Front | 0 | 0 | 0 | 0 | 0% | 0.1% | 30 | ||
Ward results
Percentage change in party votes are from the last time the ward was contested. This is either 2015 or 2016.
Alfreton
| Party | Candidate | Votes | % | ±% | |
|---|---|---|---|---|---|
| Labour | John Walker | 993 | 59.7% | +6.1 | |
| Conservative | Colin Boyce | 555 | 33.2% | +13.7 | |
| Green | Leo Swarvett | 75 | 4.5% | +1.6 | |
| Liberal Democrats | Kate Smith | 49 | 2.9% | -2.0 | |
| Majority | 438 | ||||
| Turnout | 1672 | ||||
| Labour hold | Swing | ||||
Belper East
| Party | Candidate | Votes | % | ±% | |
|---|---|---|---|---|---|
| Labour | Fay Atkinson | 812 | 44.9% | +14.4 | |
| Conservative | Martin Tomlinson | 753 | 41.6% | -5.5 | |
| Liberal Democrats | Adam Raphael | 164 | 9.1% | +9.1 | |
| Green | Julie Wozniczka | 79 | 4.4% | -2.8 | |
| Majority | 59 | ||||
| Turnout | 1808 | ||||
| Labour gain from Conservative | Swing | ||||
Belper South
| Party | Candidate | Votes | % | ±% | |
|---|---|---|---|---|---|
| Labour | Carol Angharad | 811 | 47.7% | +17.5 | |
| Conservative | Timothy Sutton | 629 | 37.0% | -3.8 | |
| Green | Sue MacFarlane | 130 | 7.6% | -6.5 | |
| Independent | Steven White | 71 | 4.2% | +4.2 | |
| Liberal Democrats | Richard Salmon | 60 | 3.5% | +3.5 | |
| Majority | 182 | ||||
| Turnout | 1701 | ||||
| Labour hold | Swing | ||||
Codnor and Waingroves
| Party | Candidate | Votes | % | ±% | |
|---|---|---|---|---|---|
| Labour | Isobel Harry | 689 | 51.2% | -2.2 | |
| Conservative | Matthew Murray | 615 | 45.7% | +20.1 | |
| Liberal Democrats | Jeremy Miles | 43 | 3.2% | +1.6 | |
| Majority | 74 | ||||
| Turnout | 1347 | ||||
| Labour hold | Swing | ||||
Duffield
| Party | Candidate | Votes | % | ±% | |
|---|---|---|---|---|---|
| Conservative | Chris Short | 898 | 48.0% | -15.6 | |
| Green | Dave Wells | 637 | 34.1% | +25.0 | |
| Labour | Patrick Mountain | 225 | 12.0% | -7.4 | |
| Liberal Democrats | Andrea Nove | 110 | 5.9% | -1.9 | |
| Majority | 262 | ||||
| Turnout | 1870 | ||||
| Conservative hold | Swing | ||||
Heanor and Loscoe
| Party | Candidate | Votes | % | ±% | |
|---|---|---|---|---|---|
| Labour | Hannah Stirland | 654 | 48.0% | +7.9 | |
| Conservative | Sue Iliffe | 620 | 45.6% | +19.7 | |
| Green | James Brooks | 60 | 4.4% | +1.3 | |
| Liberal Democrats | John Morrissey | 29 | 2.1% | -0.6 | |
| Majority | 34 | ||||
| Turnout | 1363 | ||||
| Labour hold | Swing | ||||
Heanor East
| Party | Candidate | Votes | % | ±% | |
|---|---|---|---|---|---|
| Conservative | Henry Thompson | 669 | 49.8% | +19.5 | |
| Labour | Frank Carmichael | 583 | 43.4% | +5.2 | |
| Liberal Democrats | Jerry Marler | 92 | 6.8% | +3.8 | |
| Majority | 86 | ||||
| Turnout | 1344 | ||||
| Conservative gain from Labour | Swing | ||||
Heanor West
| Party | Candidate | Votes | % | ±% | |
|---|---|---|---|---|---|
| Conservative | Steven Grainger | 698 | 46.7% | +18.3 | |
| Labour | Paul Jones | 670 | 44.8% | +2.6 | |
| Green | Lian Pizzey | 78 | 5.2% | +2.5 | |
| Liberal Democrats | Chris Oakley | 49 | 3.3% | +0.3 | |
| Majority | 28 | ||||
| Turnout | 1495 | ||||
| Conservative gain from Labour | Swing | ||||
Ironville and Riddings
| Party | Candidate | Votes | % | ±% | |
|---|---|---|---|---|---|
| Labour | Paul Smith | 917 | 54.4% | +14.6 | |
| Conservative | Pete Clark | 703 | 41.7% | +1.0 | |
| Liberal Democrats | George Turner | 66 | 3.9% | +2.0 | |
| Majority | 214 | ||||
| Turnout | 1686 | ||||
| Labour hold | Swing | ||||
Kilburn, Denby and Holbrook
| Party | Candidate | Votes | % | ±% | |
|---|---|---|---|---|---|
| Conservative | Trevor Ainsworth | 1345 | 57.4% | +6.9 | |
| Labour | Sam Hart | 785 | 33.5% | +3.3 | |
| Liberal Democrats | Susan Allen | 113 | 4.8% | +0.9 | |
| Green | Steve Kennedy | 99 | 4.2% | -0.3 | |
| Majority | 560 | ||||
| Turnout | 2342 | ||||
| Conservative hold | Swing | ||||
Langley Mill and Aldercar
| Party | Candidate | Votes | % | ±% | |
|---|---|---|---|---|---|
| Labour | Eileen Hamilton | 535 | 48.7% | +5.2 | |
| Conservative | Victoria Stevenson | 488 | 44.4% | +11.9 | |
| Liberal Democrats | Joanna Jones | 45 | 4.1% | +2.8 | |
| National Front | Timothy Knowles | 30 | 2.7% | +1.4 | |
| Majority | 47 | ||||
| Turnout | 1098 | ||||
| Labour hold | Swing | ||||
Ripley
| Party | Candidate | Votes | % | ±% | |
|---|---|---|---|---|---|
| Conservative | Sean Carter | 1207 | 49.6% | +10.6 | |
| Labour | Roland Emmas-Williams | 1061 | 43.6% | +3.5 | |
| Liberal Democrats | Richard Smeeton | 89 | 3.7% | +1.7 | |
| Green | Will MacFarlane | 75 | 3.1% | +0.6 | |
| Majority | 146 | ||||
| Turnout | 2432 | ||||
| Conservative gain from Labour | Swing | ||||
Shipley Park, Horsley and Horsley Woodhouse
| Party | Candidate | Votes | % | ±% | |
|---|---|---|---|---|---|
| Conservative | Richard Iliffe | 1172 | 64.3% | +12.7 | |
| Labour | Christine Venables | 436 | 23.9% | +1.8 | |
| Liberal Democrats | Jacob Holt | 117 | 6.4% | +3.3 | |
| Green | Tina Pritchard | 97 | 5.3% | +1.6 | |
| Majority | 736 | ||||
| Turnout | 1822 | ||||
| Conservative hold | Swing | ||||
Somercotes
| Party | Candidate | Votes | % | ±% | |
|---|---|---|---|---|---|
| Labour | Brian Lyttle | 789 | 66.6% | +8.2 | |
| Conservative | Kathy Moss | 358 | 30.2% | +17.1 | |
| Liberal Democrats | Colin Thompson | 37 | 3.1% | +0.8 | |
| Majority | 431 | ||||
| Turnout | 1184 | ||||
| Labour hold | Swing | ||||
Swanwick
| Party | Candidate | Votes | % | ±% | |
|---|---|---|---|---|---|
| Conservative | David Wilson | 1013 | 59.6% | +7.2 | |
| Labour | Charlie Robinson | 457 | 26.9% | -0.7 | |
| Liberal Democrats | Joel Hunt | 119 | 7.0% | +5.5 | |
| Green | Steve Elliott | 110 | 6.5% | +2.6 | |
| Majority | 556 | ||||
| Turnout | 1699 | ||||
| Conservative hold | Swing | ||||
References
- "Statement of persons nominated". Retrieved 10 April 2018.
This article is issued from Wikipedia. The text is licensed under Creative Commons - Attribution - Sharealike. Additional terms may apply for the media files.