2016 Derby City Council election
The 2016 Derby City Council election took place on 5 May 2016 to elect members of Derby City Council in England.[3] This was on the same day as other local elections. The Labour Party retained control of the council, albeit with their majority reduced to just one seat.
| |||||||||||||||||||||||||||||||||||||||||||||||||||||
17 of the 51 seats to Derby City Council 26 seats needed for a majority | |||||||||||||||||||||||||||||||||||||||||||||||||||||
|---|---|---|---|---|---|---|---|---|---|---|---|---|---|---|---|---|---|---|---|---|---|---|---|---|---|---|---|---|---|---|---|---|---|---|---|---|---|---|---|---|---|---|---|---|---|---|---|---|---|---|---|---|---|
| |||||||||||||||||||||||||||||||||||||||||||||||||||||
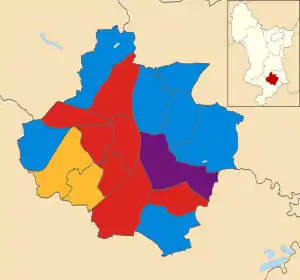 Map showing the results of contested wards in the 2016 Derby City Council elections. | |||||||||||||||||||||||||||||||||||||||||||||||||||||
| |||||||||||||||||||||||||||||||||||||||||||||||||||||
Overall results
| Party | Seats | Gains | Losses | Net gain/loss | Seats % | Votes % | Votes | +/− | |
|---|---|---|---|---|---|---|---|---|---|
| Conservative | 7 | 3 | 0 | 41.2 | 34.2 | 19,881 | |||
| Labour | 7 | 0 | 3 | 41.2 | 31.6 | 18,410 | |||
| Liberal Democrats | 2 | 0 | 1 | 11.8 | 15.0 | 8,738 | |||
| UKIP | 1 | 1 | 0 | 5.9 | 15.6 | 9,107 | |||
| Green | 0 | 0 | 0 | 0.0 | 1.9 | 1,086 | |||
| Independent | 0 | 0 | 0 | 0.0 | 0.8 | 443 | |||
| TUSC | 0 | 0 | 0 | 0.0 | 0.8 | 441 | |||
| British Independents | 0 | 0 | 0 | 0.0 | 0.1 | 83 | |||
| Link Party | 0 | 0 | 0 | 0.0 | 0.1 | 45 | |||
All comparisons in vote share are to the corresponding 2012 election.
At the previous election the composition of the council was:
| 29 | 14 | 6 | 2 |
| Labour | Conservative | LD | UKIP |
After the election the composition of the council was:
| 26 | 17 | 5 | 3 |
| Labour | Conservative | LD | UKIP |
Ward results
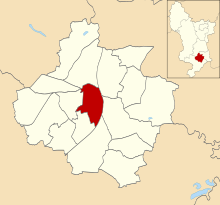
Abbey
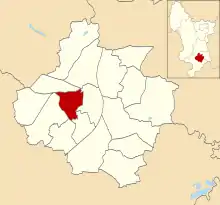
Location of Abbey ward
| Party | Candidate | Votes | % | |
|---|---|---|---|---|
| Labour | Sarah Elizabeth Russell | 1,152 | 41.3% | |
| Liberal Democrats | Ajit Singh Atwal | 764 | 27.4% | |
| Conservative | Jordan Kemp | 409 | 14.6% | |
| UKIP | Barry Appleby | 296 | 10.6% | |
| Green | George Hind | 138 | 4.9% | |
| TUSC | Jonathan Sykes | 33 | 1.2% | |
| Majority | 388 | 13.9% | ||
| Turnout | 2,792 | 29.3% | ||
| Labour hold | ||||
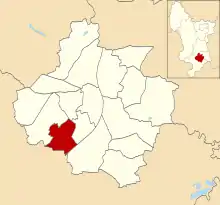
Allestree
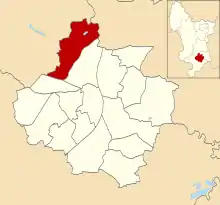
Location of Allestree ward
| Party | Candidate | Votes | % | |
|---|---|---|---|---|
| Conservative | Richard Jason Smalley | 2,820 | 60.7% | |
| Labour | Oleg Sotnicenko | 785 | 16.9% | |
| Liberal Democrats | Deena Smith | 534 | 11.5% | |
| UKIP | Frank Leeming | 508 | 10.9% | |
| Majority | 2,035 | 41.9% | ||
| Turnout | 4,647 | 42.1% | ||
| Conservative hold | ||||
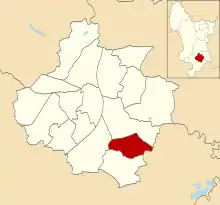
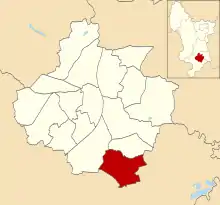
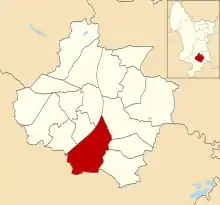
Alvaston
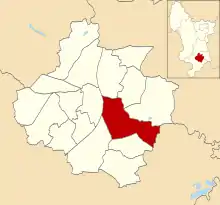
Location of Alvaston ward
| Party | Candidate | Votes | % | |
|---|---|---|---|---|
| UKIP | John Evans | 1,562 | 46.3% | |
| Labour | Mark Stuart Tittley | 1,120 | 33.2% | |
| Conservative | Christopher Philip King | 429 | 12.7% | |
| Liberal Democrats | Robert John Mason | 179 | 5.3% | |
| British Independents | David Andrew Gale | 45 | 1.3% | |
| TUSC | Jo Warren | 42 | 1.2% | |
| Majority | 442 | 13.1% | ||
| Turnout | 3,377 | 29.7% | ||
| UKIP gain from Labour | ||||
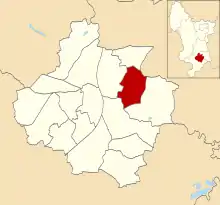
Arboretum
Location of Arboretum ward
| Party | Candidate | Votes | % | |
|---|---|---|---|---|
| Labour | Gulfraz Nawaz | 1,707 | 48.0% | |
| Conservative | Matlub Hussain | 1,280 | 36.0% | |
| UKIP | Jhanzab Arif | 190 | 5.3% | |
| Liberal Democrats | David Robert Batey | 171 | 4.8% | |
| Green | Ian Christopher Sleeman | 132 | 3.7% | |
| TUSC | Lesley Butler | 77 | 2.2% | |
| Majority | 427 | 12.0% | ||
| Turnout | 3,557 | 33.7% | ||
| Labour hold | ||||
Blagreaves
Location of Blagreaves ward
| Party | Candidate | Votes | % | |
|---|---|---|---|---|
| Liberal Democrats | Joe Naitta | 1,818 | 47.2% | |
| Labour | Cecile Yvonne Wright | 1,198 | 31.1% | |
| UKIP | Vincent Davis | 417 | 10.8% | |
| Conservative | David Rodney Jennings | 416 | 10.8% | |
| Majority | 620 | 16.1% | ||
| Turnout | 3,849 | 39.4% | ||
| Liberal Democrats hold | ||||
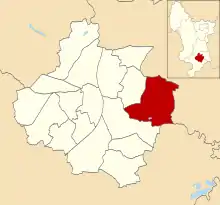
Boulton
Location of Boulton ward
| Party | Candidate | Votes | % | |
|---|---|---|---|---|
| Labour | Dom Anderson | 981 | 33.1% | |
| UKIP | Gaurav Pandey | 971 | 32.8% | |
| Conservative | Steve Willoughby | 681 | 23.0% | |
| Green | Leon Adam Nixon | 148 | 5.0% | |
| Liberal Democrats | Greg Webb | 137 | 4.6% | |
| TUSC | Shaun Christopher Stuart | 43 | 1.5% | |
| Majority | 10 | 0.3% | ||
| Turnout | 2,961 | 29.8% | ||
| Labour hold | ||||
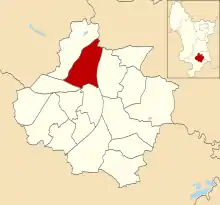
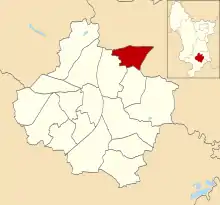
Chaddesden
Location of Chaddesten ward
| Party | Candidate | Votes | % | |
|---|---|---|---|---|
| Conservative | Jonathan Charles Smale | 1,160 | 36.2% | |
| Labour | Sue Cowlishaw | 1,070 | 33.4% | |
| UKIP | Anthony Joseph Crawley | 735 | 22.9% | |
| Independent | Paul Hilliard | 127 | 4.0% | |
| Liberal Democrats | Tim Hallam | 114 | 3.6% | |
| Majority | 90 | 2.8% | ||
| Turnout | 3,206 | 32.3% | ||
| Conservative gain from Labour | ||||
Chellaston
Location of Chellaston ward
| Party | Candidate | Votes | % | |
|---|---|---|---|---|
| Conservative | Sean William Marshall | 1,603 | 44.5% | |
| Labour | James Matthew West | 1,016 | 28.2% | |
| UKIP | Ian Edward Crompton | 552 | 15.3% | |
| Liberal Democrats | Jane Elizabeth Katharine Webb | 429 | 11.9% | |
| Majority | 587 | 16.3% | ||
| Turnout | 3,600 | 31.7% | ||
| Conservative hold | ||||
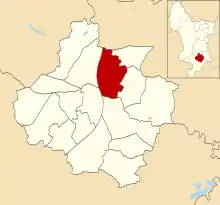
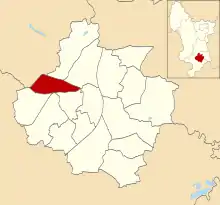
Darley
Location of Darley ward
| Party | Candidate | Votes | % | |
|---|---|---|---|---|
| Labour | Jack Stanton | 1,459 | 40.8% | |
| Conservative | Ged Potter | 1,135 | 31.8% | |
| Green | Marten Kats | 377 | 17.8% | |
| UKIP | Andrew Leslie Bennett | 337 | 9.4% | |
| Liberal Democrats | Stephen Francis Connolly | 219 | 6.1% | |
| TUSC | Chris Fernandez | 45 | 1.3% | |
| Majority | 324 | 9.1% | ||
| Turnout | 3,572 | 35.1% | ||
| Labour hold | ||||
Derwent
Location of Derwent ward
| Party | Candidate | Votes | % | |
|---|---|---|---|---|
| Conservative | Richard Hudson | 814 | 33.4% | |
| Labour | Margaret Eileen Redfern | 811 | 33.2% | |
| UKIP | Martin Fitzpatrick | 660 | 27.0% | |
| Liberal Democrats | Simon Ferrigno | 155 | 6.4% | |
| Majority | 3 | 0.1% | ||
| Turnout | 2,440 | 25.3% | ||
| Conservative hold | ||||
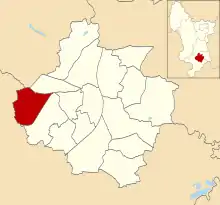
Littleover
Location of Littleover ward
| Party | Candidate | Votes | % | |
|---|---|---|---|---|
| Liberal Democrats | Eric Ashburner | 2,094 | 51.4% | |
| Labour | Cheryl Jacqueline Pidgeon | 994 | 24.4% | |
| Conservative | Peter Stanley Berry | 662 | 16.2% | |
| UKIP | Arron Mathew Marsden | 244 | 6.0% | |
| Link Party | Tony Welch | 83 | 2.0% | |
| Majority | 1,100 | 27.0% | ||
| Turnout | 4,077 | 38.4% | ||
| Liberal Democrats hold | ||||
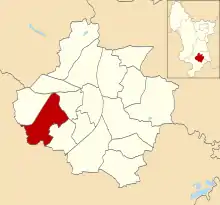
Mackworth
Location of Mackworth ward
| Party | Candidate | Votes | % | |
|---|---|---|---|---|
| Labour | Paul James Pegg | 975 | 36.0% | |
| UKIP | Rob Cooper | 816 | 30.1% | |
| Conservative | Adrian Michael Pegg | 623 | 23.0% | |
| Liberal Democrats | Ian Colin Deuchar Care | 130 | 4.8% | |
| Green | Kyle Mark Bolderson | 123 | 4.5% | |
| TUSC | Stevie Rosso | 44 | 1.6% | |
| Majority | 159 | 5.9% | ||
| Turnout | 2,711 | 28.8% | ||
| Labour hold | ||||
Mickleover
Location of Mickleover ward
| Party | Candidate | Votes | % | |
|---|---|---|---|---|
| Conservative | Matthew Edward Holmes | 2,549 | 51.1% | |
| Liberal Democrats | Maggie Hird | 1,525 | 30.6% | |
| Labour | Craig Lee Thomson | 560 | 11.2% | |
| UKIP | Kirk Lewis Kus | 353 | 7.1% | |
| Majority | 1,024 | 20.5% | ||
| Turnout | 4,987 | 43.3% | ||
| Conservative gain from Liberal Democrats | ||||
Normanton
Location of Normanton ward
| Party | Candidate | Votes | % | |
|---|---|---|---|---|
| Labour | Hardyal Singh Dhindsa | 1,869 | 53.2% | |
| Conservative | Habib Iqbal | 1,052 | 29.9% | |
| UKIP | Shaikh Mushtaq Ahmed | 276 | 7.9% | |
| Liberal Democrats | Preetinder Kaur Butter | 115 | 3.3% | |
| Green | Fred Gough | 107 | 3.0% | |
| TUSC | Terence Mortimer Anderson | 96 | 2.7% | |
| Majority | 817 | 23.2% | ||
| Turnout | 3,515 | 35.4% | ||
| Labour hold | ||||
Oakwood
Location of Oakwood ward
| Party | Candidate | Votes | % | |
|---|---|---|---|---|
| Conservative | Frank Harwood | 1,820 | 58.3% | |
| Labour | Neil Wilson | 549 | 17.6% | |
| UKIP | Joanna Rachel Beck | 342 | 11.0% | |
| Independent | Alex Dann | 316 | 10.1% | |
| Liberal Democrats | Roger Anthony Jackson | 93 | 3.0% | |
| Majority | 1,271 | 40.7% | ||
| Turnout | 3,120 | 31.1% | ||
| Conservative hold | ||||
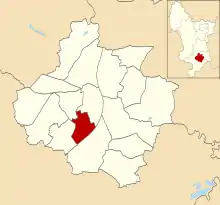
Sinfin
Location of Sinfin ward
| Party | Candidate | Votes | % | |
|---|---|---|---|---|
| Labour | Baggy Shanker | 1,377 | 56.7% | |
| Conservative | Adam Mark Hurt | 401 | 16.5% | |
| UKIP | Jayprakash Joshi | 384 | 15.8% | |
| Liberal Democrats | Paul John Lind | 144 | 5.9% | |
| Green | Kayleigh Beth Skipper | 61 | 2.5% | |
| TUSC | Zbigniew Wojcik | 61 | 2.5% | |
| Majority | 976 | 40.2% | ||
| Turnout | 2,428 | 24.5% | ||
| Labour hold | ||||
Spondon
Location of Spondon ward
| Party | Candidate | Votes | % | |
|---|---|---|---|---|
| Conservative | Evonne Williams | 2,027 | 59.7% | |
| Labour | Michael Steven Winfield | 787 | 23.2% | |
| UKIP | Vaughan Saxby | 464 | 13.7% | |
| Liberal Democrats | John-Paul Keane | 117 | 3.4% | |
| Majority | 1,240 | 36.5% | ||
| Turnout | 3,395 | 34.0% | ||
| Conservative hold | ||||
References
- "Derby election: Labour hold control of city council". BBC News. 6 May 2016.
- "Local Election 2016". Derby City Council.
- "Guide to May 2016 elections in Scotland, Wales, England and Northern Ireland". BBC News. Retrieved 21 April 2016.
This article is issued from Wikipedia. The text is licensed under Creative Commons - Attribution - Sharealike. Additional terms may apply for the media files.