Saint-Savournin
Saint-Savournin is a commune east of Marseille at the eastern extremity of the Massif de l'Étoile between Cadolive and Mimet in the Bouches-du-Rhône department in the Provence-Alpes-Côte d'Azur region in southern France.
Saint-Savournin | |
|---|---|
 The village of Saint-Savournin | |
.svg.png.webp) Coat of arms | |
Location of Saint-Savournin 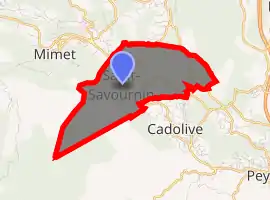
| |
 Saint-Savournin  Saint-Savournin | |
| Coordinates: 43°24′22″N 5°31′41″E | |
| Country | France |
| Region | Provence-Alpes-Côte d'Azur |
| Department | Bouches-du-Rhône |
| Arrondissement | Marseille |
| Canton | Allauch |
| Intercommunality | Aix-Marseille-Provence |
| Government | |
| • Mayor (2008–2014) | André Lenel |
| Area 1 | 5.89 km2 (2.27 sq mi) |
| Population (2017-01-01)[1] | 3,361 |
| • Density | 570/km2 (1,500/sq mi) |
| Time zone | UTC+01:00 (CET) |
| • Summer (DST) | UTC+02:00 (CEST) |
| INSEE/Postal code | 13101 /13119 |
| Dialling codes | 0491 |
| Elevation | 307–778 m (1,007–2,552 ft) (avg. 450 m or 1,480 ft) |
| 1 French Land Register data, which excludes lakes, ponds, glaciers > 1 km2 (0.386 sq mi or 247 acres) and river estuaries. | |
History
Signs of neolithic settlement have been found and extensive evidence has been identified of human habitation during the Gallo-Roman centuries.
Medieval Saint-Savournin was a village that made its living from the land, rearing sheep and goats and cultivating olives.
Population
| Year | Pop. | ±% |
|---|---|---|
| 1793 | 369 | — |
| 1800 | 429 | +16.3% |
| 1806 | 513 | +19.6% |
| 1821 | 612 | +19.3% |
| 1831 | 735 | +20.1% |
| 1836 | 759 | +3.3% |
| 1841 | 797 | +5.0% |
| 1846 | 813 | +2.0% |
| 1851 | 904 | +11.2% |
| 1856 | 1,006 | +11.3% |
| 1861 | 1,111 | +10.4% |
| 1866 | 1,266 | +14.0% |
| 1872 | 1,392 | +10.0% |
| 1876 | 1,553 | +11.6% |
| 1881 | 1,775 | +14.3% |
| 1886 | 1,753 | −1.2% |
| 1891 | 1,931 | +10.2% |
| 1896 | 1,820 | −5.7% |
| 1901 | 987 | −45.8% |
| 1906 | 997 | +1.0% |
| 1911 | 984 | −1.3% |
| 1921 | 1,092 | +11.0% |
| 1926 | 1,211 | +10.9% |
| 1931 | 1,225 | +1.2% |
| 1936 | 1,110 | −9.4% |
| 1946 | 1,168 | +5.2% |
| 1954 | 1,199 | +2.7% |
| 1962 | 1,184 | −1.3% |
| 1968 | 1,120 | −5.4% |
| 1975 | 1,140 | +1.8% |
| 1982 | 1,589 | +39.4% |
| 1990 | 2,093 | +31.7% |
| 1999 | 2,556 | +22.1% |
| 2008 | 3,095 | +21.1% |
References
- "Populations légales 2017". INSEE. Retrieved 6 January 2020.
External links
| Wikimedia Commons has media related to Saint-Savournin. |
| Authority control |
|
|---|
This article is issued from Wikipedia. The text is licensed under Creative Commons - Attribution - Sharealike. Additional terms may apply for the media files.