1964 United States presidential election in New Jersey
The 1964 United States presidential election in New Jersey took place on November 3, 1964. All 50 states and the District of Columbia, were part of the 1964 United States presidential election. Voters chose 17 electors to the Electoral College, which selected the president and vice president.
| ||||||||||||||||||||||||||
| ||||||||||||||||||||||||||
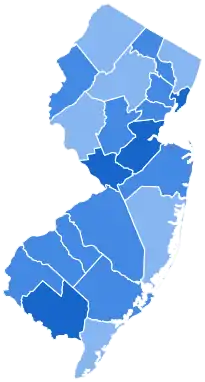 County Results
Johnson 50-60% 60-70% 70-80%
| ||||||||||||||||||||||||||
| ||||||||||||||||||||||||||


| Elections in New Jersey |
|---|
 |
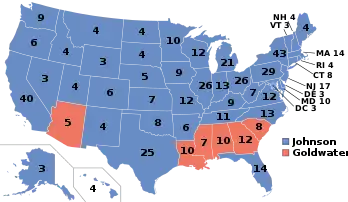
New Jersey was won overwhelmingly by the Democratic nominees, incumbent President Lyndon B. Johnson of Texas and his running mate Senator Hubert H. Humphrey of Minnesota. Johnson and Humphrey defeated the Republican nominees, Senator Barry Goldwater of Arizona and his running mate Congressman William E. Miller of New York.
Johnson carried New Jersey in a landslide with 65.61% of the vote to Goldwater’s 33.86%, a margin of 31.75%.[1]
Johnson also swept all twenty-one of New Jersey’s counties, the first and to date only time a Democratic presidential nominee has ever done so.[2] Johnson was the first Democrat to ever carry Ocean County since it was created in 1850.[3] He was also the first Democrat since Woodrow Wilson in 1912 to carry Monmouth and Morris Counties and the first since Wilson in 1916 to carry Sussex County, whilst the counties of Bergen, Cape May, Hunterdon and Somerset went Democratic for the first time since FDR‘s 1936 landslide against Alf Landon.[4]
Johnson broke 60% of the vote in 15 counties, and 70% in 4: Hudson, Mercer, Middlesex, and Cumberland, besides falling just short of the mark in Essex County, where Johnson received 69.9%. Hudson would be the most Democratic county, giving Johnson 73.5% of the vote. Goldwater’s strongest county was rural Sussex County, where he received 45.2% of the vote to Johnson’s 54.8%.
New Jersey in this era was usually a swing state with a slight Republican lean. But this normal pattern was broken in 1964, as Goldwater’s staunch conservatism led many moderate Northeastern Republicans to view Goldwater as an extremist and defect to the Democrats that year. As Johnson won a massive landslide nationally, normally GOP-leaning New Jersey’s result would even be almost 10% more Democratic than the national average. This was also the last time New Jersey would go to a Democratic candidate for president until 1992, after which it has always gone Democratic since. As of the 2020 presidential election, this is the last election in which Sussex County, Hunterdon County, and Warren County voted for a Democratic presidential candidate. Somerset County did not vote Democratic again until 2008 and Morris County would not vote Democratic again until 2020.[5]
General Election
Results
| 1964 United States presidential election in New Jersey | |||||
|---|---|---|---|---|---|
| Party | Candidate | Votes | Percentage | Electoral votes | |
| Democratic | Lyndon B. Johnson | 1,867,671 | 65.61% | 17 | |
| Republican | Barry Goldwater | 963,843 | 33.86% | 0 | |
| Socialist Workers | Clifton DeBerry | 8,181 | 0.29% | 0 | |
| Socialist Labor | Eric Hass | 7,075 | 0.25% | 0 | |
| Totals | 2,846,770 | 100.0% | 17 | ||
| Voter Turnout (Voting age/Registered) | 69%/88% | ||||
Results by county
| County | Lyndon Baines Johnson Democratic |
Barry Morris Goldwater Republican |
Clifton DeBerry[6] Socialist Workers |
Eric Hass[6] Socialist Labor |
Margin | Total votes cast | |||||
|---|---|---|---|---|---|---|---|---|---|---|---|
| # | % | # | % | # | % | # | % | # | % | ||
| Atlantic | 50,945 | 65.30% | 25,626 | 32.85% | 1,217 | 1.56% | 231 | 0.30% | 25,319 | 32.45% | 78,019 |
| Bergen | 234,849 | 59.69% | 157,899 | 40.13% | 475 | 0.12% | 242 | 0.06% | 76,950 | 19.56% | 393,465 |
| Burlington | 57,638 | 64.80% | 31,215 | 35.09% | 60 | 0.07% | 32 | 0.04% | 26,423 | 29.71% | 88,945 |
| Camden | 124,620 | 67.09% | 60,844 | 32.75% | 47 | 0.03% | 250 | 0.13% | 63,776 | 34.33% | 185,761 |
| Cape May | 14,943 | 56.65% | 11,390 | 43.18% | 13 | 0.05% | 34 | 0.13% | 3,553 | 13.47% | 26,380 |
| Cumberland | 33,593 | 72.69% | 12,611 | 27.29% | 6 | 0.01% | 5 | 0.01% | 20,982 | 45.40% | 46,215 |
| Essex | 277,042 | 69.88% | 116,172 | 29.30% | 385 | 0.10% | 2,878 | 0.73% | 160,870 | 40.57% | 396,477 |
| Gloucester | 40,305 | 62.93% | 23,702 | 37.00% | 10 | 0.02% | 35 | 0.05% | 16,603 | 25.92% | 64,052 |
| Hudson | 200,051 | 73.55% | 69,515 | 25.56% | 211 | 0.08% | 2,232 | 0.82% | 130,536 | 47.99% | 272,009 |
| Hunterdon | 15,091 | 59.69% | 10,173 | 40.24% | 14 | 0.06% | 5 | 0.02% | 4,918 | 19.45% | 25,283 |
| Mercer | 86,985 | 71.17% | 35,081 | 28.70% | 49 | 0.04% | 99 | 0.08% | 51,904 | 42.47% | 122,214 |
| Middlesex | 151,196 | 70.12% | 63,370 | 29.39% | 840 | 0.39% | 212 | 0.10% | 87,826 | 40.73% | 215,618 |
| Monmouth | 95,320 | 60.69% | 61,367 | 39.07% | 261 | 0.18% | 107 | 0.07% | 33,953 | 21.62% | 157,055 |
| Morris | 73,684 | 57.16% | 55,024 | 42.68% | 125 | 0.10% | 80 | 0.06% | 18,660 | 14.47% | 128,913 |
| Ocean | 36,892 | 57.90% | 25,985 | 40.78% | 764 | 1.20% | 73 | 0.11% | 10,907 | 17.12% | 63,714 |
| Passaic | 113,919 | 63.39% | 63,114 | 35.12% | 2,362 | 1.31% | 304 | 0.17% | 50,805 | 28.27% | 179,699 |
| Salem | 17,846 | 67.23% | 8,682 | 32.71% | 9 | 0.03% | 8 | 0.03% | 9,164 | 34.52% | 26,545 |
| Somerset | 43,659 | 60.41% | 28,416 | 39.32% | 150 | 0.21% | 45 | 0.06% | 15,243 | 21.09% | 72,270 |
| Sussex | 14,349 | 54.77% | 11,836 | 45.18% | 3 | 0.01% | 9 | 0.03% | 2,513 | 9.59% | 26,197 |
| Union | 164,989 | 66.17% | 82,999 | 33.29% | 1,178 | 0.47% | 181 | 0.07% | 81,990 | 32.88% | 249,347 |
| Warren | 19,755 | 69.09% | 8,822 | 30.85% | 2 | 0.01% | 13 | 0.05% | 10,933 | 38.24% | 28,592 |
| Totals | 1,867,671 | 65.61% | 963,843 | 33.86% | 8,181 | 0.29% | 7,075 | 0.25% | 903,828 | 31.75% | 2,846,770 |
References
- "1964 Presidential General Election Results – New Jersey". Dave Leip’s Atlas of U.S. Presidential Elections. Retrieved 25 November 2013.
- Thomas, G. Scott; The Pursuit of the White House: A Handbook of Presidential Election Statistics and History, pp. 439-440 ISBN 0313257957
- Menendez, Albert J.; The Geography of Presidential Elections in the United States, 1868-2004, p. 90 ISBN 0786422173
- Menendez; The Geography of Presidential Elections in the United States, p.
- Sullivan, Robert David; ‘How the Red and Blue Map Evolved Over the Past Century’; America Magazine in The National Catholic Review; June 29, 2016
- Our Campaigns; NJ US President 1964