1964 United States presidential election in Nevada
The 1964 United States presidential election in Nevada took place on November 3, 1964, as part of the 1964 United States presidential election. State voters chose three[2] representatives, or electors, to the Electoral College, who voted for president and vice president.
| ||||||||||||||||||||||||||
| ||||||||||||||||||||||||||
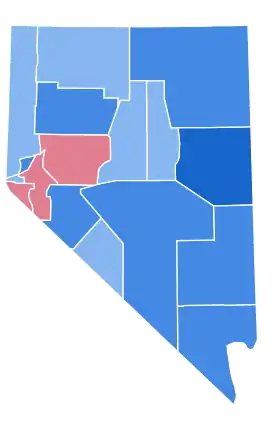 County Results
| ||||||||||||||||||||||||||
| ||||||||||||||||||||||||||


| Elections in Nevada |
|---|
 |
| None of These Candidates |
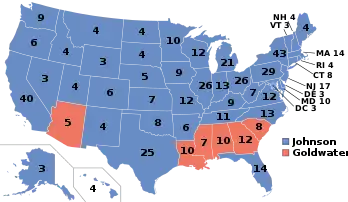
Nevada was won by incumbent President Lyndon B. Johnson (D–Texas), with 58.58% of the popular vote, against Senator Barry Goldwater (R–Arizona), with 41.42% of the popular vote.[3][4]
As of the 2020 presidential election, this is the last election in which Elko County, Humboldt County, Pershing County, Lander County, Lincoln County, and Eureka County voted for a Democratic Presidential candidate. Washoe County did not vote Democratic again until 2008.[5]
Results
| Party | Candidate | Votes | % | |
|---|---|---|---|---|
| Democratic | Lyndon B. Johnson (inc.) | 79,339 | 58.58% | |
| Republican | Barry Goldwater | 56,094 | 41.42% | |
| Total votes | 135,433 | 100% | ||
Results by county
| County | Lyndon Baines Johnson Democratic |
Barry Morris Goldwater Republican |
Margin | Total votes cast[6] | |||
|---|---|---|---|---|---|---|---|
| # | % | # | % | # | % | ||
| Churchill | 1,565 | 49.34% | 1,607 | 50.66% | -42 | -1.32% | 3,172 |
| Clark | 40,760 | 63.02% | 23,921 | 36.98% | 16,839 | 26.03% | 64,681 |
| Douglas | 1,010 | 47.26% | 1,127 | 52.74% | -117 | -5.47% | 2,137 |
| Elko | 2,785 | 60.01% | 1,856 | 39.99% | 929 | 20.02% | 4,641 |
| Esmeralda | 187 | 58.81% | 131 | 41.19% | 56 | 17.61% | 318 |
| Eureka | 285 | 53.98% | 243 | 46.02% | 42 | 7.95% | 528 |
| Humboldt | 1,421 | 56.23% | 1,106 | 43.77% | 315 | 12.47% | 2,527 |
| Lander | 391 | 53.64% | 338 | 46.36% | 53 | 7.27% | 729 |
| Lincoln | 785 | 64.08% | 440 | 35.92% | 345 | 28.16% | 1,225 |
| Lyon | 1,327 | 48.72% | 1,397 | 51.28% | -70 | -2.57% | 2,724 |
| Mineral | 1,440 | 60.84% | 927 | 39.16% | 513 | 21.67% | 2,367 |
| Nye | 1,276 | 60.82% | 822 | 39.18% | 454 | 21.64% | 2,098 |
| Ormsby | 2,129 | 51.60% | 1,997 | 48.40% | 132 | 3.20% | 4,126 |
| Pershing | 738 | 60.29% | 486 | 39.71% | 252 | 20.59% | 1,224 |
| Storey | 261 | 60.28% | 172 | 39.72% | 89 | 20.55% | 433 |
| Washoe | 20,170 | 52.36% | 18,350 | 47.64% | 1,820 | 4.72% | 38,520 |
| White Pine | 2,809 | 70.52% | 1,174 | 29.48% | 1,635 | 41.05% | 3,983 |
| Totals | 79,339 | 58.58% | 56,094 | 41.42% | 23,245 | 17.16% | 135,433 |
References
- "United States Presidential election of 1964 - Encyclopædia Britannica". Retrieved May 29, 2017.
- "1964 Election for the Forty-Fifth Term (1965-69)". Retrieved May 29, 2017.
- "1964 Presidential General Election Results - Nevada". Retrieved May 29, 2017.
- "The American Presidency Project - Election of 1964". Retrieved May 29, 2017.
- Sullivan, Robert David; ‘How the Red and Blue Map Evolved Over the Past Century’; America Magazine in The National Catholic Review; June 29, 2016
- Scammon, Richard M. (compiler); America at the Polls: A Handbook of Presidential Election Statistics 1920-1964; p. 291 ISBN 0405077114
This article is issued from Wikipedia. The text is licensed under Creative Commons - Attribution - Sharealike. Additional terms may apply for the media files.