List of U.S. states and territories by GDP per capita
This is a list of U.S. states and U.S. territories sorted by their gross domestic product (GDP) per capita. The United States Bureau of Economic Analysis (BEA) defines GDP by state as "the sum of value added from all industries in the state."[1]
Real
| Rank | State | 2018 | 2017 | 2016 | 2015 | 2014 | 2013 | 2012 | 2011 |
|---|---|---|---|---|---|---|---|---|---|
| — | 160,472 | 159,227 | 159,395 | 159,497 | 163,274 | 166,870 | 168,030 | 166,178 | |
| 1 | 65,545 | 64,507 | 62,510 | 61,882 | 62,456 | 61,769 | 60,808 | 59,178 | |
| 2 | 64,579 | 64,093 | 63,420 | 62,444 | 62,841 | 61,185 | 61,267 | 59,481 | |
| 3 | 64,511 | 63,747 | 62,236 | 62,550 | 63,502 | 63,638 | 64,906 | 65,574 | |
| 4 | 63,971 | 67,705 | 67,411 | 69,700 | 73,478 | 70,573 | 69,564 | 72,204 | |
| 5 | 63,664 | 64,040 | 63,271 | 60,719 | 62,174 | 63,793 | 62,837 | 64,313 | |
| 6 | 62,837 | 67,305 | 71,056 | 67,651 | 68,105 | 57,066 | 52,185 | 48,858 | |
| 7 | 58,821 | 60,908 | 61,417 | 60,770 | 60,777 | 63,985 | 64,603 | 66,320 | |
| 8 | 58,619 | 57,328 | 55,374 | 53,855 | 52,974 | 52,099 | 51,871 | 51,733 | |
| 9 | 57,084 | 56,472 | 55,635 | 55,750 | 55,161 | 54,302 | 55,023 | 55,067 | |
| 10 | 56,831 | 55,780 | 55,001 | 54,161 | 53,439 | 52,500 | 52,679 | 52,264 | |
| 11 | 55,404 | 54,894 | 54,003 | 53,765 | 54,018 | 54,209 | 53,675 | 52,515 | |
| 12 | 54,091 | 53,432 | 52,795 | 51,963 | 52,172 | 51,198 | 50,304 | 49,859 | |
| 13 | 53,795 | 54,421 | 52,993 | 52,018 | 50,266 | 48,354 | 47,417 | 47,034 | |
| 14 | 53,704 | 53,380 | 53,005 | 51,999 | 51,272 | 50,875 | 50,148 | 48,884 | |
| 15 | 53,114 | 52,878 | 53,099 | 51,565 | 50,631 | 51,360 | 49,569 | 47,973 | |
| 16 | 52,795 | 52,622 | 52,019 | 50,475 | 49,639 | 49,285 | 49,254 | 49,731 | |
| 17 | 51,794 | 50,456 | 49,480 | 48,871 | 48,652 | 48,504 | 48,388 | 47,265 | |
| 18 | 51,736 | 51,716 | 50,803 | 51,106 | 51,546 | 51,754 | 51,946 | 51,389 | |
| 19 | 51,277 | 50,320 | 49,497 | 49,539 | 49,513 | 49,331 | 49,418 | 48,549 | |
| 20 | 50,997 | 50,418 | 49,155 | 48,278 | 47,540 | 46,872 | 46,387 | 45,312 | |
| 21 | 50,582 | 49,792 | 48,342 | 48,094 | 49,395 | 51,266 | 49,601 | 47,530 | |
| — | 50,577 | 50,155 | 49,253 | 48,538 | 48,173 | 47,595 | 47,287 | 46,680 | |
| 22 | 50,315 | 50,086 | 49,218 | 48,002 | 48,001 | 46,523 | 45,884 | 45,195 | |
| 23 | 48,076 | 47,706 | 46,776 | 46,869 | 46,965 | 47,972 | 45,605 | 45,457 | |
| 24 | 47,639 | 47,118 | 46,668 | 46,356 | 46,188 | 46,010 | 46,332 | 45,280 | |
| 25 | 47,567 | 46,826 | 46,385 | 45,254 | 44,896 | 44,192 | 42,667 | 41,593 | |
| 26 | 47,266 | 46,859 | 46,340 | 45,845 | 45,382 | 44,906 | 44,126 | 43,215 | |
| 27 | 46,982 | 46,890 | 46,003 | 45,470 | 45,514 | 45,476 | 44,243 | 43,770 | |
| 28 | 45,317 | 44,797 | 44,577 | 43,866 | 43,064 | 43,058 | 42,996 | 40,572 | |
| 29 | 44,723 | 43,913 | 43,313 | 42,500 | 42,191 | 42,140 | 42,029 | 42,052 | |
| 30 | 44,636 | 44,204 | 43,069 | 42,267 | 41,929 | 41,992 | 41,500 | 41,563 | |
| 31 | 44,623 | 45,864 | 45,007 | 43,288 | 41,861 | 39,961 | 38,303 | 38,640 | |
| 32 | 44,325 | 44,096 | 43,372 | 42,945 | 42,659 | 43,223 | 43,141 | 43,160 | |
| 33 | 43,946 | 43,495 | 43,039 | 42,914 | 43,042 | 43,124 | 42,170 | 40,855 | |
| 34 | 43,917 | 44,293 | 44,254 | 43,725 | 45,482 | 45,712 | 48,599 | 46,949 | |
| 35 | 43,820 | 43,649 | 42,927 | 43,075 | 43,382 | 44,555 | 44,589 | 44,774 | |
| 36 | 43,372 | 42,631 | 41,514 | 40,993 | 40,463 | 39,757 | 38,763 | 36,676 | |
| 37 | 43,317 | 42,943 | 42,442 | 42,487 | 41,926 | 41,598 | 42,204 | 42,012 | |
| 38 | 43,267 | 42,797 | 41,828 | 41,487 | 41,091 | 40,193 | 39,370 | 39,096 | |
| 39 | 41,348 | 41,577 | 40,842 | 39,659 | 40,094 | 40,167 | 40,297 | 40,670 | |
| 40 | 39,543 | 39,093 | 38,398 | 38,023 | 37,705 | 37,876 | 38,604 | 38,695 | |
| 41 | 39,356 | 39,686 | 39,214 | 38,476 | 38,537 | 38,542 | 37,733 | 36,667 | |
| 42 | 38,985 | 38,603 | 38,298 | 38,247 | 38,052 | 37,926 | 37,579 | 36,209 | |
| 43 | 38,921 | 38,450 | 38,014 | 37,477 | 37,705 | 37,780 | 38,352 | 37,910 | |
| 44 | 38,590 | 38,414 | 38,427 | 38,303 | 38,559 | 38,257 | 37,935 | 38,232 | |
| 45 | 37,261 | 36,856 | 36,538 | 36,660 | 36,425 | 36,201 | 35,913 | 35,376 | |
| 46 | 37,063 | 36,796 | 36,295 | 35,701 | 35,346 | 35,609 | 35,126 | 34,955 | |
| 47 | 36,368 | 36,196 | 36,249 | 35,865 | 34,965 | 35,146 | 34,671 | 33,837 | |
| 48 | 36,315 | 36,453 | 36,161 | 35,755 | 35,509 | 36,084 | 35,368 | 34,564 | |
| 49 | 35,466 | 35,467 | 35,099 | 34,748 | 34,094 | 34,270 | 34,620 | 34,664 | |
| 50 | 31,881 | 31,633 | 31,522 | 31,923 | 31,786 | 31,167 | 31,688 | 31,658 |
Current
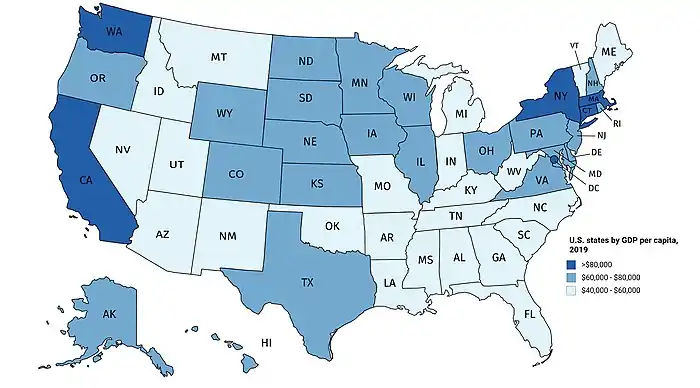
U.S. states by GDP per capita, 2019
| National rank | Global rank | State or territory | 2019 |
|---|---|---|---|
| 1 | 1 | 200,277 | |
| 2 | 2 | 90,043 | |
| 3 | 2 | 86,942 | |
| 4 | 3 | 78,468 | |
| 5 | 3 | 81,055 | |
| 6 | 4 | 80,563 | |
| 7 | 4 | 80,170 | |
| 8 | 4 | 76,220 | |
| 9 | 4 | 75,321 | |
| 10 | 6 | 68,757 | |
| 11 | 6 | 73,451 | |
| 12 | 6 | 71,838 | |
| 13 | 6 | 71,727 | |
| 14 | 6 | 68,427 | |
| 15 | 6 | 69,593 | |
| 16 | 6 | 66,737 | |
| 17 | 6 | 68,828 | |
| 18 | 6 | 66,069 | |
| 19 | 6 | 65,824 | |
| — | 6 | 65,281 | |
| 20 | 6 | 64,412 | |
| 21 | 6 | 66,149 | |
| 22 | 8 | 62,493 | |
| 23 | 8 | 61,104 | |
| 24 | 8 | 60,830 | |
| 25 | 8 | 60,425 | |
| 26 | 8 | 60,464 | |
| 27 | 9 | 60,558 | |
| 28 | 10 | 60,310 | |
| 29 | 10 | 58,896 | |
| 30 | 11 | 59,892 | |
| 31 | 11 | 58,570 | |
| 32 | 11 | 56,702 | |
| 33 | 11 | 56,862 | |
| 34 | 11 | 53,933 | |
| 35 | 11 | 57,445 | |
| 36 | 11 | 56,525 | |
| 37 | 11 | 54,928 | |
| 38 | 12 | 54,879 | |
| 39 | 12 | 52,409 | |
| 40 | 13 | 51,745 | |
| 41 | 13 | 51,179 | |
| 42 | 13 | 50,915 | |
| 43 | 15 | 50,022 | |
| 44 | 16 | 48,697 | |
| 45 | 15 | 49,540 | |
| 46 | 16 | 48,547 | |
| 47 | 17 | 47,735 | |
| 48 | 19 | 46,043 | |
| 49 | 19 | 43,806 | |
| 50 | 19 | 44,808 | |
| 51 | 24 | 40,464 | |
| 52 | — | 37,000[4] | |
| 53 | — | 35,600[5] | |
| 54 | — | 31,651[6] | |
| 55 | — | 24,500[7] | |
| 56 | — | 11,200[8] |
Map
This is a map of U.S. states by nominal GDP per capita in United States dollars, 2017.
| >$70,000 $50,000–$70,000 <$50,000 |
See also
References
- "BEA Glossary". Bureau of Economic Analysis. U.S. Department of Commerce. Archived from the original on 28 September 2017. Retrieved 6 June 2017.
- "Per capita real GDP by state (chained 2009 dollars)". Bureau of Economic Analysis. Retrieved 8 June 2017.
- For GDP by state, see "Gross domestic product (GDP) by state (millions of current dollars)". Bureau of Economic Analysis. Retrieved 8 June 2017.
For population by state, see "Annual Estimates of the Resident Population for the United States, Regions, States, and Puerto Rico: April 1, 2010 to July 1, 2016" (XLSX). United States Census Bureau. Retrieved 8 June 2017. - "Central America :: Virgin Islands — The World Factbook - Central Intelligence Agency". www.cia.gov.
- "Australia - Oceania :: Guam — The World Factbook - Central Intelligence Agency". www.cia.gov.
- "Archived copy". Archived from the original on 2020-07-02. Retrieved 2020-06-29.CS1 maint: archived copy as title (link)
- "Australia - Oceania :: Northern Mariana Islands — The World Factbook - Central Intelligence Agency". www.cia.gov.
- "Australia - Oceania :: American Samoa — The World Factbook - Central Intelligence Agency". www.cia.gov.
This article is issued from Wikipedia. The text is licensed under Creative Commons - Attribution - Sharealike. Additional terms may apply for the media files.