2000 United States presidential election in Indiana
The 2000 United States presidential election in Indiana took place on November 7, 2000, and was part of the 2000 United States presidential election. Voters chose 12 representatives, or electors to the Electoral College, who voted for president and vice president.
| ||||||||||||||||||||||||||
| ||||||||||||||||||||||||||
 County Results
| ||||||||||||||||||||||||||
| ||||||||||||||||||||||||||

| Elections in Indiana |
|---|
 |
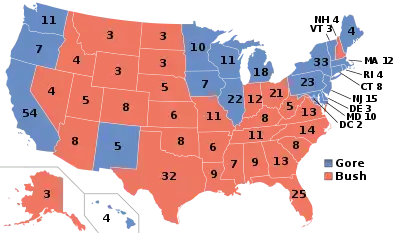
Indiana was won by Texas Governor George W. Bush. He won a majority of the counties and congressional districts in the state. Gore only won two congressional districts and six counties. However, Gore won five of the six counties by very small margins. Lake County, part of the Chicago metropolitan area and the state's second most-populous county,[1] was Gore's best performance, winning with over 60%. Bush ran up the margins in more conservative rural areas to help him win the state. Bush won Vigo County with 49.7% of the vote, which is considered the most reliable bellwether county in the nation.
This would be the last time that Marion County and Monroe County voted for the Republican nominee, as they would end up shifting to Democratic strongholds in future elections. Conversely, this is also the last time that Scott County voted for the Democratic candidate.
Results
| 2000 United States presidential election in Indiana[2] | |||||
|---|---|---|---|---|---|
| Party | Candidate | Votes | Percentage | Electoral votes | |
| Republican | George Walker Bush | 1,245,836 | 56.7% | 12 | |
| Democratic | Albert Arnold Gore Jr. | 901,980 | 41.0% | 0 | |
| Write In | Ralph Nader | 18,531 | 0.8% | 0 | |
| Reform | Patrick Buchanan | 16,959 | 0.8% | 0 | |
| Libertarian | Harry Browne | 15,530 | 0.7% | 0 | |
| Write In | Howard Phillips | 200 | 0.0% | 0 | |
| Write In | John Hagelin | 167 | 0.0% | 0 | |
| Totals | 2,199,203 | 100.00% | 12 | ||
| Voter turnout (Voting age/registered) | 49%/55% | ||||
Results breakdown
By county
Gore won only 6 of Indiana's counties compared to 86 for Bush.[3]
| County | Gore | Votes | Bush | Votes | Others | Votes |
|---|---|---|---|---|---|---|
| Adams | 30.0% | 3,775 | 68.0% | 8,555 | 2.1% | 260 |
| Allen | 36.4% | 41,636 | 61.6% | 70,426 | 2.0% | 2,258 |
| Bartholomew | 35.0% | 9,015 | 62.9% | 16,200 | 2.1% | 554 |
| Benton | 34.3% | 1,328 | 63.0% | 2,441 | 2.7% | 105 |
| Blackford | 43.0% | 2,103 | 55.2% | 2,699 | 1.9% | 91 |
| Boone | 25.9% | 4,763 | 71.5% | 13,161 | 2.6% | 472 |
| Brown | 38.3% | 2,608 | 56.8% | 3,871 | 5.0% | 338 |
| Carroll | 35.9% | 2,965 | 61.7% | 5,102 | 2.5% | 201 |
| Cass | 35.8% | 5,412 | 61.6% | 9,305 | 2.6% | 389 |
| Clark | 46.5% | 17,360 | 52.0% | 19,417 | 1.5% | 599 |
| Clay | 35.5% | 3,605 | 62.9% | 6,393 | 1.6% | 160 |
| Clinton | 33.1% | 3,643 | 65.0% | 7,141 | 1.9% | 207 |
| Crawford | 43.2% | 1,817 | 55.3% | 2,327 | 1.5% | 65 |
| Daviess | 27.6% | 2,697 | 70.4% | 6,872 | 2.0% | 192 |
| Dearborn | 34.1% | 6,020 | 64.9% | 11,452 | 1.0% | 178 |
| Decatur | 31.5% | 2,889 | 66.7% | 6,115 | 1.8% | 167 |
| DeKalb | 34.6% | 4,776 | 63.1% | 8,701 | 2.2% | 308 |
| Delaware | 47.3% | 20,876 | 50.1% | 22,105 | 2.6% | 1,166 |
| Dubois | 32.8% | 5,090 | 65.4% | 10,134 | 1.8% | 280 |
| Elkhart | 30.1% | 16,402 | 67.5% | 36,756 | 2.4% | 1,324 |
| Fayette | 39.5% | 3,415 | 58.5% | 5,060 | 2.0% | 172 |
| Floyd | 44.0% | 13,209 | 54.9% | 16,486 | 1.1% | 335 |
| Fountain | 37.3% | 2,717 | 60.5% | 4,408 | 2.1% | 156 |
| Franklin | 31.1% | 2,591 | 67.0% | 5,587 | 1.9% | 161 |
| Fulton | 35.6% | 2,960 | 62.7% | 5,218 | 1.8% | 149 |
| Gibson | 42.1% | 5,802 | 56.2% | 7,734 | 1.7% | 236 |
| Grant | 36.8% | 9,712 | 61.2% | 16,153 | 2.0% | 521 |
| Greene | 38.8% | 4,898 | 59.1% | 7,452 | 2.1% | 269 |
| Hamilton | 23.7% | 18,002 | 74.3% | 56,372 | 2.0% | 1,552 |
| Hancock | 28.3% | 6,503 | 69.5% | 15,943 | 2.2% | 504 |
| Harrison | 39.4% | 5,870 | 58.5% | 8,711 | 2.1% | 315 |
| Hendricks | 26.8% | 10,786 | 71.2% | 28,651 | 2.0% | 784 |
| Henry | 41.8% | 7,647 | 56.4% | 10,321 | 1.9% | 347 |
| Howard | 37.8% | 12,899 | 59.6% | 20,331 | 2.5% | 865 |
| Huntington | 28.2% | 4,119 | 69.2% | 10,113 | 2.7% | 388 |
| Jackson | 36.5% | 5,330 | 62.0% | 9,054 | 1.5% | 218 |
| Jasper | 33.5% | 3,744 | 64.6% | 7,212 | 1.9% | 211 |
| Jay | 39.4% | 3,167 | 58.4% | 4,687 | 2.2% | 176 |
| Jefferson | 42.9% | 5,117 | 55.2% | 6,582 | 1.9% | 232 |
| Jennings | 37.4% | 3,549 | 60.4% | 5,732 | 2.2% | 213 |
| Johnson | 28.3% | 11,952 | 69.5% | 29,404 | 2.2% | 928 |
| Knox | 41.9% | 6,300 | 56.4% | 8,485 | 1.8% | 269 |
| Kosciusko | 22.9% | 5,785 | 75.3% | 19,040 | 1.8% | 459 |
| LaGrange | 32.8% | 2,733 | 65.3% | 5,437 | 2.0% | 163 |
| Lake | 62.0% | 109,078 | 36.0% | 63,389 | 2.0% | 3,527 |
| LaPorte | 49.7% | 19,736 | 47.8% | 18,994 | 2.6% | 1,017 |
| Lawrence | 31.4% | 5,071 | 66.1% | 10,677 | 2.4% | 394 |
| Madison | 44.8% | 23,403 | 53.5% | 27,956 | 1.6% | 857 |
| Marion | 47.9 | 134,189 | 49.2% | 137,810 | 2.9% | 7,904 |
| Marshall | 34.4% | 5,541 | 63.6% | 10,266 | 2.1% | 343 |
| Martin | 32.9% | 1,518 | 65.3% | 3,008 | 1.8% | 83 |
| Miami | 32.1% | 4,155 | 65.0% | 8,401 | 2.9% | 372 |
| Monroe | 43.6% | 17,523 | 47.6% | 19,147 | 8.8% | 3,550 |
| Montgomery | 29.8% | 3,899 | 67.9% | 8,891 | 2.4% | 311 |
| Morgan | 28.3% | 6,228 | 69.4% | 15,286 | 2.4% | 522 |
| Newton | 38.1% | 2,101 | 59.0% | 3,250 | 2.9% | 159 |
| Noble | 33.9% | 4,822 | 64.0% | 9,103 | 2.1% | 291 |
| Ohio | 38.2% | 951 | 60.8% | 1,515 | 1.0% | 26 |
| Orange | 34.9% | 2,601 | 62.9% | 4,687 | 2.3% | 170 |
| Owen | 34.7% | 2,253 | 61.8% | 4,019 | 3.6% | 231 |
| Parke | 38.5% | 2,481 | 59.6% | 3,841 | 1.9% | 125 |
| Perry | 51.8% | 3,823 | 46.9% | 3,461 | 1.4% | 103 |
| Pike | 41.3% | 2,605 | 56.6% | 3,566 | 2.1% | 131 |
| Porter | 45.1% | 26,790 | 52.5% | 31,157 | 2.4% | 1,431 |
| Posey | 39.9% | 4,430 | 58.5% | 6,498 | 1.6% | 182 |
| Pulaski | 34.8% | 1,919 | 63.4% | 3,497 | 1.9% | 102 |
| Putnam | 34.7% | 4,123 | 61.9% | 7,352 | 3.3% | 396 |
| Randolph | 38.6% | 3,906 | 59.4% | 6,020 | 2.0% | 206 |
| Ripley | 32.8% | 3,498 | 65.5% | 6,988 | 1.8% | 189 |
| Rush | 32.5% | 2,370 | 65.2% | 4,749 | 2.3% | 165 |
| St. Joseph | 48.9% | 47,703 | 48.3% | 47,581 | 2.3% | 2,190 |
| Scott | 49.9% | 3,915 | 47.9% | 3,761 | 2.2% | 170 |
| Shelby | 35.1% | 5,374 | 62.6% | 9,590 | 2.3% | 346 |
| Spencer | 41.8% | 3,752 | 56.7% | 5,096 | 1.6% | 139 |
| Starke | 47.5% | 4,136 | 50.0% | 4,349 | 2.5% | 216 |
| Steuben | 36.4% | 4,103 | 61.7% | 6,953 | 2.0% | 221 |
| Sullivan | 46.4% | 3,833 | 52.3% | 4,319 | 1.3% | 110 |
| Switzerland | 41.3% | 1,336 | 56.5% | 1,831 | 2.2% | 72 |
| Tippecanoe | 39.4% | 18,220 | 56.4% | 26,106 | 4.3% | 1,969 |
| Tipton | 32.7% | 2,392 | 65.4% | 4,784 | 0.8% | 61 |
| Union | 32.8% | 927 | 65.0% | 1,838 | 2.2% | 63 |
| Vanderburgh | 44.1% | 29,222 | 54.1% | 35,846 | 1.7% | 1,153 |
| Vermillion | 50.8% | 3,370 | 47.2% | 3,130 | 2.0% | 133 |
| Vigo | 48.5% | 17,570 | 49.7% | 18,021 | 1.8% | 637 |
| Wabash | 33.2% | 4,277 | 64.6% | 8,321 | 2.2% | 285 |
| Warren | 39.0% | 1,471 | 58.9% | 2,218 | 2.1% | 79 |
| Warrick | 39.2% | 8,749 | 59.2% | 13,205 | 1.6% | 355 |
| Washington | 37.5% | 3,675 | 59.9% | 5,868 | 2.6% | 258 |
| Wayne | 40.9% | 10,273 | 56.8% | 14,273 | 2.4% | 605 |
| Wells | 29.4% | 3,319 | 68.7% | 7,755 | 1.8% | 207 |
| White | 36.9% | 3,655 | 61.0% | 6,037 | 2.1% | 212 |
| Whitley | 33.0% | 4,107 | 65.0% | 8,080 | 2.0% | 245 |
By congressional district
Bush won 8 of 10 congressional districts.[4]
| District | Bush | Gore | Representative |
|---|---|---|---|
| 1st | 38% | 58% | Pete Visclosky |
| 2nd | 56% | 41% | David M. McIntosh |
| Mike Pence | |||
| 3rd | 55% | 42% | Tim Roemer |
| 4th | 62% | 34% | Mark Souder |
| 5th | 60% | 36% | Steve Buyer |
| 6th | 67% | 28% | Dan Burton |
| 7th | 61% | 35% | Edward A. Pease |
| Brian D. Kerns | |||
| 8th | 55% | 40% | John Hostettler |
| 9th | 57% | 39% | Baron Hill |
| 10th | 38% | 59% | Julia Carson |
Electors
Technically the voters of Indiana cast their ballots for electors: representatives to the Electoral College. Indiana is allocated 12 electors because it has 10 congressional districts and 2 senators. All candidates who appear on the ballot or qualify to receive write-in votes must submit a list of 12 electors, who pledge to vote for their candidate and his or her running mate. Whoever wins the majority of votes in the state is awarded all 12 electoral votes. Their chosen electors then vote for president and vice president. Although electors are pledged to their candidate and running mate, they are not obligated to vote for them. An elector who votes for someone other than his or her candidate is known as a faithless elector.
The electors of each state and the District of Columbia met on December 18, 2000[5] to cast their votes for president and vice president. The Electoral College itself never meets as one body. Instead the electors from each state and the District of Columbia met in their respective capitols.
The following were the members of the Electoral College from the state. All were pledged to and voted for George W. Bush and Dick Cheney:[6]
- Rodric D. Bray
- Roger A. Chiabai
- Beverly Gard
- Don Heckard
- Marla Irving
- Virginia Lee
- P.E. MacAllister
- Barbara L. McClellan
- Michael D. McDaniel
- Max Middendorf
- Michael Miner
- Virgil Scheidt
References
- "Census 2000 PHC-T-4. Ranking Tables for Counties: 1990 and 2000" (PDF). United States Census Bureau. Archived (PDF) from the original on December 18, 2014. Retrieved July 10, 2014.
- "2000 Presidential General Election Results - Indiana".
- https://uselectionatlas.org/RESULTS/
- https://uselectionatlas.org/RESULTS/data.php?year=2000&fips=18&f=0&off=0&elect=0&datatype=cd&def=1
- http://www.uselectionatlas.org/INFORMATION/ARTICLES/pe2000timeline.php
- "Archived copy". Archived from the original on 2012-02-12. Retrieved 2009-10-25.CS1 maint: archived copy as title (link)