List of European countries by life expectancy
Map
The map and table below cites life expectancy per country from The World Bank's 2018 statistics.[1] Hotter colours indicate lower life expectancy, colder colours indicate high life expectancy.
76
Gulf of
Cadiz
Cadiz
Life expectancy by Country (2016)
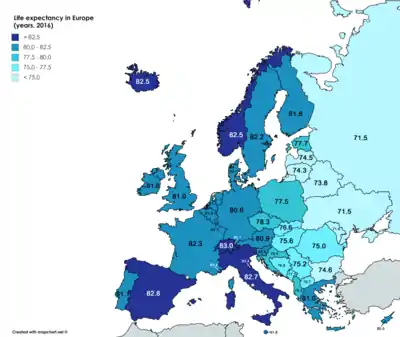
Life expectancy in years in European countries, 2016
| Rank | Country | Life expectancy[1] | Influenza vaccination rate, people aged 65 and over, 2016 (%)[2] |
|---|---|---|---|
| 1 | 89.4 | ||
| 2 | 83.4 | ||
| 3 | 83.0 | ||
| 4 | 82.8 | 56% | |
| 5 | 82.7 | 28% | |
| 6 | 82.7 | 50% | |
| 7 | 82.5 | 38% | |
| 8 | 82.5 | 47% | |
| 9 | 82.3 | 38% | |
| 10 | 82.3 | 50% | |
| 11 | 82.2 | 49% | |
| 12 | 81.8 | ||
| 13 | 81.8 | 47% | |
| 14 | 81.6 | 55% | |
| 15 | 81.5 | 65% | |
| 16 | 81.1 | 58% | |
| 17 | 81.0 | ||
| 18 | 81.0 | 71% | |
| 19 | 81.0 | ||
| 20 | 80.9 | ||
| 21 | 80.8 | 10% | |
| 22 | 80.7 | 41% | |
| 23 | 80.6 | 35% | |
| 24 | 80.5 | ||
| 25 | 78.3 | ||
| 26 | 78.3 | ||
| 27 | 78.0 | 21% | |
| 28 | 77.7 | 3% | |
| 29 | 77.5 | ||
| 30 | 77.1 | 13% | |
| 31 | 76.9 | ||
| 32 | 76.6 | 10% | |
| 33 | 75.8 | 7% | |
| 34 | 75.7 | 6% | |
| 35 | 75.6 | 20% | |
| 36 | 75.2 | 11% | |
| 37 | 75.0 | 8% | |
| 38 | 74.6 | ||
| 39 | 74.5 | 4% | |
| 40 | 74.3 | 23% | |
| 41 | 73.8 | ||
| 42 | 72.1 | ||
| 43 | 71.6 | ||
| 44 | 71.6 | ||
See also
Plotted maps
- European countries by electricity consumption per person
- European countries by employment in agriculture (% of employed)
- European countries by fossil fuel use (% of total energy)
- European countries by health expense per person
- European countries by military expenditure as a percentage of government expenditure
- European countries by percent of population aged 0-14
- European countries by percentage of urban population
- European countries by percentage of women in national parliaments
- List of European countries by number of Internet users
- International organisations in Europe
- List of European countries by budget revenues
- List of European countries by budget revenues per capita
- List of European countries by GDP (nominal) per capita
- List of European countries by GDP (PPP) per capita
- List of European countries by GNI (nominal) per capita
- List of European countries by GNI (PPP) per capita
- List of countries by GDP (nominal) per capita
- List of countries by GDP (PPP) per capita
- List of countries by GDP (nominal)
- List of countries by GDP (PPP)
References
- "Life expectancy at birth, total (years)". WORLDBANK.org. The World Bank. Retrieved 10 August 2018.
- "Vaccination against influenza of population aged 65 and over". eurostat.
- "Europe :: Monaco — The World Factbook - Central Intelligence Agency". www.cia.gov. Retrieved 2019-03-29.
- "Europe :: San Marino — The World Factbook - Central Intelligence Agency". www.cia.gov. Retrieved 2019-03-29.
This article is issued from Wikipedia. The text is licensed under Creative Commons - Attribution - Sharealike. Additional terms may apply for the media files.