1988 United States presidential election in Illinois
The 1988 United States presidential election in Illinois took place on November 8, 1988. All 50 states and the District of Columbia were part of the 1988 United States presidential election. State voters chose 24 electors to the Electoral College, which selected the president and vice president.
| ||||||||||||||||||||||||||
| Turnout | 71.72% | |||||||||||||||||||||||||
|---|---|---|---|---|---|---|---|---|---|---|---|---|---|---|---|---|---|---|---|---|---|---|---|---|---|---|
| ||||||||||||||||||||||||||
 County Results
| ||||||||||||||||||||||||||
| ||||||||||||||||||||||||||
.jpg.webp)

| Elections in Illinois |
|---|
 |
|
|
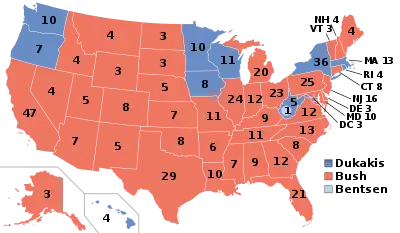
Illinois was won by incumbent United States Vice President George H. W. Bush of Texas, who was running against Massachusetts Governor Michael Dukakis. Bush ran with Indiana Senator Dan Quayle as vice president, and Dukakis ran with Texas Senator Lloyd Bentsen.
Illinois weighed in for this election as 5.4% more Democratic than the national average. As of the 2020 presidential election, this was the last time Illinois voted Republican in a presidential election.
Election information
The primaries and general elections coincided with those for congress, as well as those for state offices.[1][2]
Primaries
State-run primaries were held for the Democratic, Republican, parties on March 15.[1]
Democratic
| ||||||||||||||||||||||||||||||||||||||||
| ||||||||||||||||||||||||||||||||||||||||
_(1).jpg.webp)
.jpg.webp)
.jpg.webp)
.jpg.webp)
The 1988 Illinois Democratic presidential primary was held on March 15, 1988 in the U.S. state of Illinois as one of the Democratic Party's statewide nomination contests ahead of the 1988 presidential election.
| Candidate | Votes | % | Delegates |
|---|---|---|---|
| Paul Simon | 635,219 | 42.32 | |
| Jesse L. Jackson | 484,233 | 32.26 | |
| Michael S. Dukakis | 245,289 | 16.34 | |
| Al Gore | 77,265 | 5.15 | |
| Dick Gephardt | 35,108 | 2.34 | |
| Gary Hart withdrew | 12,769 | 0.85 | |
| Lyndon H. LaRouche | 6,094 | 0.41 | |
| Bruce Babbitt withdrew | 4,953 | 0.33 | |
| Total | 1,500,930 | 100 |
Republican
| |||||||||||||||||||||
| |||||||||||||||||||||
.jpg.webp)
.JPG.webp)
.jpg.webp)
The 1988 Illinois Republican presidential primary was held on March 15, 1988 in the U.S. state of Illinois as one of the Republican Party's statewide nomination contests ahead of the 1988 presidential election.
| Candidate | Votes | % | Delegates |
|---|---|---|---|
| George Bush | 469,151 | 54.64 | |
| Bob Dole | 309,253 | 36.02 | |
| Pat Robertson | 59,087 | 6.88 | |
| Jack F. Kemp withdrew | 12,687 | 1.48 | |
| Pete du Pont withdrew | 4,653 | 0.54 | |
| Alexander M. Haig, Jr. withdrew | 3,806 | 0.44 | |
| Total | 858,637 | 100 |
Illinois Solidarity
| |||||||||||||
| |||||||||||||
The 1988 Illinois Solidarity presidential primary was held on March 15, 1988 in the U.S. state of Illinois. Lenora Fulani won, running unopposed.
| Candidate | Votes | % |
|---|---|---|
| Lenora Fulani | 170 | 100 |
| Total | 170 | 100 |
General election
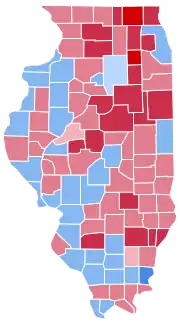
Bush won the election in the rapidly liberalizing state of Illinois with a narrow 2 point margin. Like the neighboring state of Missouri, Bush's performance here was far below that of Reagan's just four years earlier. Bush's loss of many down-state rural counties, combined with Dukakis's stronger than normal performance across much of the state, especially in Cook County, which houses the Chicago area, made the election results in this state much closer than usual. Bush would be the last Republican candidate to carry the state of Illinois in a presidential election (as of the 2020 presidential election). The election results in Illinois are reflective of a nationwide reconsolidation of base for the Republican Party, which took place through the 1980s. Through the passage of some economic programs, spearheaded by then President Ronald Reagan (called, collectively, "Reaganomics"), the mid-to-late 1980s saw a period of economic growth and stability. The hallmark for Reaganomics was, in part, the wide-scale deregulation of corporate interests, and tax cuts across the board.[3]
Dukakis ran on a socially liberal platform, and advocated for higher economic regulation and environmental protection. Bush, alternatively, ran on a campaign of continuing the social and economic policies of former President Reagan – which gained him much support with social conservatives and people living in rural areas.
The presidential election of 1988 was a very partisan election for Illinois, with more than 99% of the electorate voting for either the Democratic or Republican parties, and only five political parties listed as options on the ballot statewide.[4] As of the 2020 presidential election, 1988 is the most recent election in which Peoria County and Champaign County voted for a Republican Presidential candidate.[5]
Results
| 1988 United States presidential election in Illinois[2] | ||||||
|---|---|---|---|---|---|---|
| Party | Candidate | Running mate | Votes | % | Electoral votes | |
| Republican | George Bush | Dan Quayle | 2,310,939 | 50.69% | 24 | |
| Democratic | Michael Dukakis | Lloyd Bentsen | 2,215,940 | 48.60% | 0 | |
| Libertarian | Ron Paul | Andre Marrou | 14,944 | 0.33% | 0 | |
| Illinois Solidarity | Lenora Fulani | Joyce Dattner | 10,276 | 0.23% | 0 | |
| Socialist Equality Party | Edward Winn | Barry Porster | 7,021 | 0.15% | 0 | |
| Total | 4,559,120 | 100.0% | 24 | |||
Results by county
| County | George Herbert Walker Bush Republican |
Michael Stanley Dukakis Democratic |
Ronald Ernest Paul Libertarian |
Leonora Branch Fulani Illinois Solidarity |
Edward Winn Independent |
Margin | Total votes cast[6] | ||||||
|---|---|---|---|---|---|---|---|---|---|---|---|---|---|
| # | % | # | % | # | % | # | % | # | % | # | % | ||
| Adams | 15,831 | 53.29% | 13,768 | 46.34% | 64 | 0.22% | 18 | 0.06% | 29 | 0.10% | 2,063 | 6.94% | 29,710 |
| Alexander | 1,954 | 41.90% | 2,693 | 57.75% | 4 | 0.09% | 8 | 0.17% | 4 | 0.09% | -739 | -15.85% | 4,663 |
| Bond | 3,608 | 50.78% | 3,459 | 48.68% | 18 | 0.25% | 9 | 0.13% | 11 | 0.15% | 149 | 2.10% | 7,105 |
| Boone | 6,923 | 61.69% | 4,234 | 37.73% | 30 | 0.27% | 14 | 0.12% | 21 | 0.19% | 2,689 | 23.96% | 11,222 |
| Brown | 1,373 | 51.89% | 1,267 | 47.88% | 1 | 0.04% | 3 | 0.11% | 2 | 0.08% | 106 | 4.01% | 2,646 |
| Bureau | 8,896 | 54.41% | 7,354 | 44.98% | 42 | 0.26% | 23 | 0.14% | 36 | 0.22% | 1,542 | 9.43% | 16,351 |
| Calhoun | 1,238 | 44.37% | 1,544 | 55.34% | 2 | 0.07% | 4 | 0.14% | 2 | 0.07% | -306 | -10.97% | 2,790 |
| Carroll | 4,464 | 59.42% | 2,990 | 39.80% | 20 | 0.27% | 24 | 0.32% | 14 | 0.19% | 1,474 | 19.62% | 7,512 |
| Cass | 2,916 | 46.53% | 3,316 | 52.91% | 8 | 0.13% | 8 | 0.13% | 19 | 0.30% | -400 | -6.38% | 6,267 |
| Champaign | 33,247 | 52.36% | 29,733 | 46.82% | 264 | 0.42% | 164 | 0.26% | 91 | 0.14% | 3,514 | 5.53% | 63,499 |
| Christian | 7,040 | 45.61% | 8,295 | 53.74% | 44 | 0.29% | 23 | 0.15% | 34 | 0.22% | -1,255 | -8.13% | 15,436 |
| Clark | 4,508 | 57.71% | 3,275 | 41.93% | 11 | 0.14% | 9 | 0.12% | 8 | 0.10% | 1,233 | 15.79% | 7,811 |
| Clay | 3,494 | 55.65% | 2,761 | 43.97% | 10 | 0.16% | 5 | 0.08% | 9 | 0.14% | 733 | 11.67% | 6,279 |
| Clinton | 7,681 | 56.15% | 5,935 | 43.38% | 27 | 0.20% | 22 | 0.16% | 15 | 0.11% | 1,746 | 12.76% | 13,680 |
| Coles | 11,043 | 56.62% | 8,327 | 42.69% | 58 | 0.30% | 36 | 0.18% | 40 | 0.21% | 2,716 | 13.93% | 19,504 |
| Cook | 878,582 | 43.36% | 1,129,973 | 55.77% | 7,776 | 0.38% | 6,244 | 0.31% | 3,569 | 0.18% | -251,391 | -12.41% | 2,026,144 |
| Crawford | 4,951 | 57.76% | 3,555 | 41.48% | 32 | 0.37% | 19 | 0.22% | 14 | 0.16% | 1,396 | 16.29% | 8,571 |
| Cumberland | 2,667 | 57.98% | 1,904 | 41.39% | 9 | 0.20% | 8 | 0.17% | 12 | 0.26% | 763 | 16.59% | 4,600 |
| DeKalb | 17,182 | 58.86% | 11,811 | 40.46% | 122 | 0.42% | 37 | 0.13% | 38 | 0.13% | 5,371 | 18.40% | 29,190 |
| DeWitt | 3,942 | 59.32% | 2,660 | 40.03% | 22 | 0.33% | 12 | 0.18% | 9 | 0.14% | 1,282 | 19.29% | 6,645 |
| Douglas | 4,378 | 57.62% | 3,184 | 41.91% | 9 | 0.12% | 8 | 0.11% | 19 | 0.25% | 1,194 | 15.71% | 7,598 |
| DuPage | 217,907 | 69.39% | 94,285 | 30.02% | 1,180 | 0.38% | 360 | 0.11% | 322 | 0.10% | 123,622 | 39.36% | 314,054 |
| Edgar | 5,538 | 58.55% | 3,880 | 41.02% | 19 | 0.20% | 10 | 0.11% | 12 | 0.13% | 1,658 | 17.53% | 9,459 |
| Edwards | 2,212 | 64.12% | 1,218 | 35.30% | 5 | 0.14% | 9 | 0.26% | 6 | 0.17% | 994 | 28.81% | 3,450 |
| Effingham | 8,431 | 64.53% | 4,553 | 34.85% | 38 | 0.29% | 18 | 0.14% | 26 | 0.20% | 3,878 | 29.68% | 13,066 |
| Fayette | 5,452 | 53.88% | 4,632 | 45.78% | 15 | 0.15% | 10 | 0.10% | 9 | 0.09% | 820 | 8.10% | 10,118 |
| Ford | 4,059 | 66.05% | 2,026 | 32.97% | 22 | 0.36% | 20 | 0.33% | 18 | 0.29% | 2,033 | 33.08% | 6,145 |
| Franklin | 7,677 | 40.87% | 11,023 | 58.69% | 34 | 0.18% | 26 | 0.14% | 23 | 0.12% | -3,346 | -17.81% | 18,783 |
| Fulton | 6,999 | 43.45% | 9,046 | 56.16% | 24 | 0.15% | 22 | 0.14% | 17 | 0.11% | -2,047 | -12.71% | 16,108 |
| Gallatin | 1,580 | 38.89% | 2,455 | 60.42% | 8 | 0.20% | 9 | 0.22% | 11 | 0.27% | -875 | -21.54% | 4,063 |
| Greene | 3,136 | 50.56% | 3,020 | 48.69% | 15 | 0.24% | 16 | 0.26% | 16 | 0.26% | 116 | 1.87% | 6,203 |
| Grundy | 8,743 | 60.88% | 5,525 | 38.47% | 41 | 0.29% | 22 | 0.15% | 30 | 0.21% | 3,218 | 22.41% | 14,361 |
| Hamilton | 2,622 | 49.89% | 2,618 | 49.81% | 5 | 0.10% | 8 | 0.15% | 3 | 0.06% | 4 | 0.08% | 5,256 |
| Hancock | 4,568 | 48.71% | 4,740 | 50.54% | 37 | 0.39% | 16 | 0.17% | 17 | 0.18% | -172 | -1.83% | 9,378 |
| Hardin | 1,504 | 53.26% | 1,308 | 46.32% | 3 | 0.11% | 2 | 0.07% | 7 | 0.25% | 196 | 6.94% | 2,824 |
| Henderson | 1,726 | 45.17% | 2,085 | 54.57% | 5 | 0.13% | 1 | 0.03% | 4 | 0.10% | -359 | -9.40% | 3,821 |
| Henry | 11,358 | 49.28% | 11,594 | 50.30% | 45 | 0.20% | 23 | 0.10% | 28 | 0.12% | -236 | -1.02% | 23,048 |
| Iroquois | 9,596 | 69.11% | 4,221 | 30.40% | 24 | 0.17% | 21 | 0.15% | 24 | 0.17% | 5,375 | 38.71% | 13,886 |
| Jackson | 9,687 | 45.73% | 11,334 | 53.50% | 81 | 0.38% | 54 | 0.25% | 29 | 0.14% | -1,647 | -7.77% | 21,185 |
| Jasper | 3,024 | 58.28% | 2,135 | 41.14% | 15 | 0.29% | 5 | 0.10% | 10 | 0.19% | 889 | 17.13% | 5,189 |
| Jefferson | 7,624 | 49.42% | 7,729 | 50.10% | 34 | 0.22% | 18 | 0.12% | 21 | 0.14% | -105 | -0.68% | 15,426 |
| Jersey | 4,343 | 49.62% | 4,376 | 50.00% | 15 | 0.17% | 6 | 0.07% | 12 | 0.14% | -33 | -0.38% | 8,752 |
| Jo Daviess | 4,923 | 53.88% | 4,141 | 45.32% | 40 | 0.44% | 17 | 0.19% | 16 | 0.18% | 782 | 8.56% | 9,137 |
| Johnson | 2,797 | 59.61% | 1,872 | 39.90% | 8 | 0.17% | 11 | 0.23% | 4 | 0.09% | 925 | 19.71% | 4,692 |
| Kane | 66,283 | 64.10% | 36,366 | 35.17% | 432 | 0.42% | 170 | 0.16% | 161 | 0.16% | 29,917 | 28.93% | 103,412 |
| Kankakee | 20,316 | 56.82% | 15,147 | 42.36% | 55 | 0.15% | 202 | 0.56% | 35 | 0.10% | 5,169 | 14.46% | 35,755 |
| Kendall | 10,653 | 70.62% | 4,347 | 28.82% | 39 | 0.26% | 26 | 0.17% | 19 | 0.13% | 6,306 | 41.81% | 15,084 |
| Knox | 10,842 | 45.75% | 12,752 | 53.81% | 44 | 0.19% | 31 | 0.13% | 31 | 0.13% | -1,910 | -8.06% | 23,700 |
| Lake | 114,115 | 63.53% | 64,327 | 35.81% | 709 | 0.39% | 287 | 0.16% | 195 | 0.11% | 49,788 | 27.72% | 179,633 |
| LaSalle | 22,166 | 49.64% | 22,271 | 49.88% | 89 | 0.20% | 59 | 0.13% | 65 | 0.15% | -105 | -0.24% | 44,650 |
| Lawrence | 3,655 | 53.57% | 3,140 | 46.02% | 9 | 0.13% | 10 | 0.15% | 9 | 0.13% | 515 | 7.55% | 6,823 |
| Lee | 8,903 | 65.48% | 4,608 | 33.89% | 38 | 0.28% | 25 | 0.18% | 22 | 0.16% | 4,295 | 31.59% | 13,596 |
| Livingston | 10,324 | 67.02% | 5,009 | 32.52% | 37 | 0.24% | 18 | 0.12% | 17 | 0.11% | 5,315 | 34.50% | 15,405 |
| Logan | 8,490 | 63.90% | 4,727 | 35.58% | 33 | 0.25% | 15 | 0.11% | 21 | 0.16% | 3,763 | 28.32% | 13,286 |
| Macon | 23,862 | 48.22% | 25,364 | 51.25% | 132 | 0.27% | 66 | 0.13% | 65 | 0.13% | -1,502 | -3.04% | 49,489 |
| Macoupin | 9,362 | 43.20% | 12,195 | 56.28% | 50 | 0.23% | 30 | 0.14% | 32 | 0.15% | -2,833 | -13.07% | 21,669 |
| Madison | 44,907 | 45.04% | 54,175 | 54.34% | 268 | 0.27% | 219 | 0.22% | 126 | 0.13% | -9,268 | -9.30% | 99,695 |
| Marion | 8,695 | 50.05% | 8,592 | 49.46% | 35 | 0.20% | 24 | 0.14% | 27 | 0.16% | 103 | 0.59% | 17,373 |
| Marshall | 3,588 | 56.35% | 2,742 | 43.07% | 21 | 0.33% | 6 | 0.09% | 10 | 0.16% | 846 | 13.29% | 6,367 |
| Mason | 3,424 | 49.95% | 3,406 | 49.69% | 8 | 0.12% | 5 | 0.07% | 12 | 0.18% | 18 | 0.26% | 6,855 |
| Massac | 3,507 | 51.86% | 3,227 | 47.72% | 5 | 0.07% | 18 | 0.27% | 6 | 0.09% | 280 | 4.14% | 6,763 |
| McDonough | 7,173 | 57.42% | 5,247 | 42.00% | 28 | 0.22% | 26 | 0.21% | 19 | 0.15% | 1,926 | 15.42% | 12,493 |
| McHenry | 46,135 | 70.44% | 18,919 | 28.88% | 251 | 0.38% | 81 | 0.12% | 113 | 0.17% | 27,216 | 41.55% | 65,499 |
| McLean | 30,572 | 61.75% | 18,659 | 37.69% | 117 | 0.24% | 99 | 0.20% | 64 | 0.13% | 11,913 | 24.06% | 49,511 |
| Menard | 3,560 | 62.40% | 2,103 | 36.86% | 19 | 0.33% | 17 | 0.30% | 6 | 0.11% | 1,457 | 25.54% | 5,705 |
| Mercer | 3,683 | 46.45% | 4,204 | 53.02% | 18 | 0.23% | 9 | 0.11% | 15 | 0.19% | -521 | -6.57% | 7,929 |
| Monroe | 6,275 | 57.83% | 4,529 | 41.74% | 18 | 0.17% | 13 | 0.12% | 16 | 0.15% | 1,746 | 16.09% | 10,851 |
| Montgomery | 6,388 | 46.43% | 7,293 | 53.01% | 40 | 0.29% | 17 | 0.12% | 21 | 0.15% | -905 | -6.58% | 13,759 |
| Morgan | 8,808 | 59.17% | 6,032 | 40.52% | 29 | 0.19% | 8 | 0.05% | 9 | 0.06% | 2,776 | 18.65% | 14,886 |
| Moultrie | 3,167 | 50.98% | 3,013 | 48.50% | 14 | 0.23% | 6 | 0.10% | 12 | 0.19% | 154 | 2.48% | 6,212 |
| Ogle | 11,644 | 66.94% | 5,641 | 32.43% | 61 | 0.35% | 25 | 0.14% | 23 | 0.13% | 6,003 | 34.51% | 17,394 |
| Peoria | 37,605 | 51.35% | 35,253 | 48.14% | 172 | 0.23% | 117 | 0.16% | 83 | 0.11% | 2,352 | 3.21% | 73,230 |
| Perry | 4,576 | 46.78% | 5,167 | 52.83% | 9 | 0.09% | 13 | 0.13% | 16 | 0.16% | -591 | -6.04% | 9,781 |
| Piatt | 4,137 | 56.85% | 3,099 | 42.59% | 15 | 0.21% | 12 | 0.16% | 14 | 0.19% | 1,038 | 14.26% | 7,277 |
| Pike | 3,965 | 46.11% | 4,614 | 53.66% | 13 | 0.15% | 6 | 0.07% | 1 | 0.01% | -649 | -7.55% | 8,599 |
| Pope | 1,202 | 54.44% | 996 | 45.11% | 5 | 0.23% | 2 | 0.09% | 3 | 0.14% | 206 | 9.33% | 2,208 |
| Pulaski | 1,666 | 47.90% | 1,793 | 51.55% | 5 | 0.14% | 12 | 0.35% | 2 | 0.06% | -127 | -3.65% | 3,478 |
| Putnam | 1,516 | 48.30% | 1,601 | 51.00% | 6 | 0.19% | 6 | 0.19% | 10 | 0.32% | -85 | -2.71% | 3,139 |
| Randolph | 7,396 | 48.28% | 7,844 | 51.21% | 31 | 0.20% | 27 | 0.18% | 20 | 0.13% | -448 | -2.92% | 15,318 |
| Richland | 4,264 | 59.61% | 2,863 | 40.03% | 9 | 0.13% | 9 | 0.13% | 8 | 0.11% | 1,401 | 19.59% | 7,153 |
| Rock Island | 27,412 | 40.37% | 40,174 | 59.17% | 155 | 0.23% | 70 | 0.10% | 90 | 0.13% | -12,762 | -18.80% | 67,901 |
| Saline | 5,798 | 46.31% | 6,676 | 53.32% | 17 | 0.14% | 12 | 0.10% | 18 | 0.14% | -878 | -7.01% | 12,521 |
| Sangamon | 50,175 | 56.76% | 37,729 | 42.68% | 228 | 0.26% | 146 | 0.17% | 125 | 0.14% | 12,446 | 14.08% | 88,403 |
| Schuyler | 2,178 | 53.57% | 1,866 | 45.89% | 7 | 0.17% | 7 | 0.17% | 8 | 0.20% | 312 | 7.67% | 4,066 |
| Scott | 1,535 | 55.02% | 1,243 | 44.55% | 4 | 0.14% | 4 | 0.14% | 4 | 0.14% | 292 | 10.47% | 2,790 |
| Shelby | 5,370 | 53.28% | 4,650 | 46.14% | 19 | 0.19% | 15 | 0.15% | 24 | 0.24% | 720 | 7.14% | 10,078 |
| St. Clair | 41,439 | 42.58% | 55,465 | 57.00% | 180 | 0.18% | 133 | 0.14% | 96 | 0.10% | -14,026 | -14.41% | 97,313 |
| Stark | 1,841 | 58.39% | 1,274 | 40.41% | 19 | 0.60% | 9 | 0.29% | 10 | 0.32% | 567 | 17.98% | 3,153 |
| Stephenson | 11,342 | 59.87% | 7,460 | 39.38% | 74 | 0.39% | 39 | 0.21% | 30 | 0.16% | 3,882 | 20.49% | 18,945 |
| Tazewell | 28,861 | 53.72% | 24,603 | 45.79% | 119 | 0.22% | 69 | 0.13% | 75 | 0.14% | 4,258 | 7.93% | 53,727 |
| Union | 4,244 | 50.05% | 4,197 | 49.50% | 18 | 0.21% | 7 | 0.08% | 13 | 0.15% | 47 | 0.55% | 8,479 |
| Vermilion | 16,943 | 48.32% | 17,918 | 51.10% | 75 | 0.21% | 67 | 0.19% | 64 | 0.18% | -975 | -2.78% | 35,067 |
| Wabash | 3,453 | 60.30% | 2,241 | 39.14% | 12 | 0.21% | 8 | 0.14% | 12 | 0.21% | 1,212 | 21.17% | 5,726 |
| Warren | 4,584 | 55.54% | 3,617 | 43.82% | 18 | 0.22% | 22 | 0.27% | 13 | 0.16% | 967 | 11.72% | 8,254 |
| Washington | 4,127 | 60.04% | 2,689 | 39.12% | 18 | 0.26% | 25 | 0.36% | 15 | 0.22% | 1,438 | 20.92% | 6,874 |
| Wayne | 5,481 | 63.29% | 3,135 | 36.20% | 11 | 0.13% | 10 | 0.12% | 23 | 0.27% | 2,346 | 27.09% | 8,660 |
| White | 4,354 | 51.04% | 4,144 | 48.58% | 13 | 0.15% | 7 | 0.08% | 13 | 0.15% | 210 | 2.46% | 8,531 |
| Whiteside | 12,978 | 53.05% | 11,328 | 46.31% | 74 | 0.30% | 37 | 0.15% | 45 | 0.18% | 1,650 | 6.75% | 24,462 |
| Will | 73,129 | 59.10% | 49,816 | 40.26% | 363 | 0.29% | 259 | 0.21% | 164 | 0.13% | 23,313 | 18.84% | 123,731 |
| Williamson | 12,274 | 48.84% | 12,712 | 50.58% | 58 | 0.23% | 62 | 0.25% | 24 | 0.10% | -438 | -1.74% | 25,130 |
| Winnebago | 55,699 | 54.69% | 45,280 | 44.46% | 568 | 0.56% | 137 | 0.13% | 166 | 0.16% | 10,419 | 10.23% | 101,850 |
| Woodford | 9,474 | 66.93% | 4,604 | 32.53% | 44 | 0.31% | 13 | 0.09% | 20 | 0.14% | 4,870 | 34.40% | 14,155 |
| Totals | 2,310,939 | 50.69% | 2,215,940 | 48.60% | 14,944 | 0.33% | 10,276 | 0.23% | 7,021 | 0.15% | 94,999 | 2.08% | 4,559,120 |
References
- "OFFICIAL VOTE Cast at the GENERAL PRIMARY ELECTION MARCH 15, 1988" (PDF). www.elections.il.gov. Illinois Secretary of State. Retrieved 10 April 2020.
- "OFFICIAL VOTE Cast at the GENERAL ELECTION NOVEMBER 8, 1988" (PDF). www.elections.il.gov. Illinois State Board of Elections. Retrieved 10 April 2020.
- "Since 1980s, the Kindest of Tax Cuts for the Rich". The New York Times. 2012-01-18. Retrieved 2013-07-21.
- "1988 Presidential General Election Results – Illinois". Dave Leip's Atlas of U.S. Presidential Elections. Retrieved 2013-07-21.
- Sullivan, Robert David; ‘How the Red and Blue Map Evolved Over the Past Century’; America Magazine in The National Catholic Review; June 29, 2016
- Our Campaigns; IL US President 1988