1988 United States presidential election in Virginia
The 1988 United States presidential election in Virginia took place on November 8, 1988. All 50 states and the District of Columbia, were part of the 1988 United States presidential election. Virginia voters chose 12 electors to the Electoral College, which selected the president and vice president.
| ||||||||||||||||||||||||||
| ||||||||||||||||||||||||||
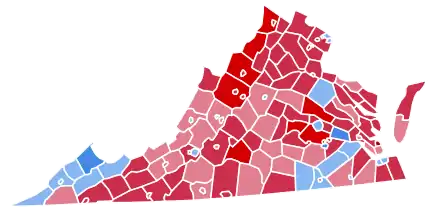 County and Independent City Results
| ||||||||||||||||||||||||||
| ||||||||||||||||||||||||||
.jpg.webp)

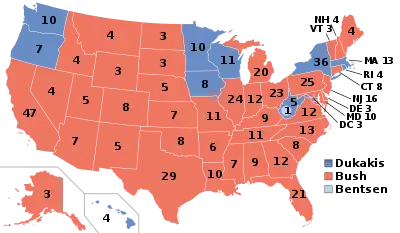
Virginia was won by incumbent United States Vice President George H. W. Bush of Texas, who was running against Massachusetts Governor Michael Dukakis. Bush ran with Indiana Senator Dan Quayle as Vice President, and Dukakis ran with Texas Senator Lloyd Bentsen.
Virginia weighed in for this election as 13% more Republican than the national average. This is also be the most recent presidential election in which the Republican won Virginia by double digits, as well as the most recent in which Virginia was decided by double digits for either party until 2020.
Partisan background
The presidential election of 1988 was a very partisan election for Virginia, with over 98% of the electorate voting for either the Democratic or Republican parties, and only 4 candidates on the ballot.[1] Most counties in Virginia turned out for Bush, including the highly populated regions of Virginia Beach and Fairfax County.
As of the 2020 presidential election, this is the last election in which Northampton County and the independent cities of Martinsville, Fredericksburg, and Hampton voted for a Republican presidential candidate.[2]
Republican victory
Bush won the election in Virginia with a solid 20 point landslide. Virginia was Bush's twelfth-best state by vote share, and his best state in the South outside the states that seceded before the beginning of the Civil War, confirming Virginia's position as a center of the new Republican South.[3] Bush ran strongly in most parts of the state, but in particular, he cracked 60% in populous Fairfax County, outside Washington, D.C., and got over 2/3 and 3/4 of the vote in the Richmond suburbs of Henrico and Chesterfield, respectively, which contributed to the swelling of his statewide margin. Dukakis did well in Arlington County, the independent cities of Richmond and Norfolk, in Virginia's Black Belt counties, and in some then-traditionally Democratic counties in heavily-unionized southwest Virginia.[4]
The election results in Virginia are also reflective of a nationwide reconsolidation of base for the Republican Party, which took place through the 1980s. Through the passage of some very controversial economic programs, spearheaded by then President Ronald Reagan (called, collectively, "Reaganomics"), the mid-to-late 1980s saw a period of economic growth and stability. The hallmark for Reaganomics was, in part, the wide-scale deregulation of corporate interests, and tax cuts for the wealthy.[5]
Dukakis ran his campaign on a socially liberal platform, and advocated for higher economic regulation and environmental protection. Bush, alternatively, ran on a campaign of continuing the social and economic policies of former President Reagan - which gained him much support with social conservatives and people living in rural areas. Additionally, while the economic programs passed under Reagan, and furthered under Bush and Clinton, may have boosted the economy for a brief period, they are criticized by many analysts as "setting the stage" for economic troubles in the United States after 2007, such as the Great Recession.[6]
| Elections in Virginia |
|---|
 |
Results
| United States presidential election in Virginia, 1988[7] | |||||
|---|---|---|---|---|---|
| Party | Candidate | Votes | Percentage | Electoral votes | |
| Republican | George H. W. Bush | 1,309,162 | 59.74% | 12 | |
| Democratic | Michael Dukakis | 859,799 | 39.23% | 0 | |
| New Alliance | Lenora Fulani | 14,312 | 0.65% | 0 | |
| Libertarian | Ron Paul | 8,336 | 0.38% | 0 | |
| Totals | 2,191,609 | 100.0% | 12 | ||
Results by county
| County or Independent City | George Herbert Walker Bush Republican |
Michael Stanley Dukakis Democratic |
Various candidates Other parties |
Margin | Total votes cast | ||||
|---|---|---|---|---|---|---|---|---|---|
| # | % | # | % | # | % | # | % | ||
| Accomack County | 6,926 | 60.01% | 4,443 | 38.49% | 173 | 1.50% | 2,483 | 21.51% | 11,542 |
| Albemarle County | 15,117 | 58.70% | 10,363 | 40.24% | 273 | 1.06% | 4,754 | 18.46% | 25,753 |
| Alleghany County | 2,555 | 51.87% | 2,316 | 47.02% | 55 | 1.12% | 239 | 4.85% | 4,926 |
| Amelia County | 2,187 | 60.85% | 1,359 | 37.81% | 48 | 1.34% | 828 | 23.04% | 3,594 |
| Amherst County | 6,507 | 64.10% | 3,567 | 35.14% | 77 | 0.76% | 2,940 | 28.96% | 10,151 |
| Appomattox County | 3,205 | 63.59% | 1,740 | 34.52% | 95 | 1.88% | 1,465 | 29.07% | 5,040 |
| Arlington County | 34,191 | 45.37% | 40,314 | 53.49% | 860 | 1.14% | -6,123 | -8.12% | 75,365 |
| Augusta County | 13,251 | 75.14% | 4,170 | 23.65% | 213 | 1.21% | 9,081 | 51.50% | 17,634 |
| Bath County | 1,273 | 58.74% | 881 | 40.66% | 13 | 0.60% | 392 | 18.09% | 2,167 |
| Bedford County | 10,702 | 65.33% | 5,406 | 33.00% | 274 | 1.67% | 5,296 | 32.33% | 16,382 |
| Bland County | 1,556 | 61.12% | 937 | 36.80% | 53 | 2.08% | 619 | 24.31% | 2,546 |
| Botetourt County | 5,687 | 59.30% | 3,763 | 39.23% | 141 | 1.47% | 1,924 | 20.06% | 9,591 |
| Brunswick County | 2,742 | 46.60% | 3,070 | 52.18% | 72 | 1.22% | -328 | -5.57% | 5,884 |
| Buchanan County | 3,912 | 35.68% | 6,935 | 63.25% | 118 | 1.08% | -3,023 | -27.57% | 10,965 |
| Buckingham County | 2,481 | 55.49% | 1,941 | 43.41% | 49 | 1.10% | 540 | 12.08% | 4,471 |
| Campbell County | 12,713 | 72.51% | 4,574 | 26.09% | 246 | 1.40% | 8,139 | 46.42% | 17,533 |
| Caroline County | 3,065 | 48.71% | 3,186 | 50.64% | 41 | 0.65% | -121 | -1.92% | 6,292 |
| Carroll County | 6,377 | 66.17% | 3,190 | 33.10% | 70 | 0.73% | 3,187 | 33.07% | 9,637 |
| Charles City County | 826 | 30.59% | 1,839 | 68.11% | 35 | 1.30% | -1,013 | -37.52% | 2,700 |
| Charlotte County | 2,699 | 57.44% | 1,923 | 40.92% | 77 | 1.64% | 776 | 16.51% | 4,699 |
| Chesterfield County | 58,828 | 75.34% | 18,723 | 23.98% | 532 | 0.68% | 40,105 | 51.36% | 78,083 |
| Clarke County | 2,502 | 62.24% | 1,478 | 36.77% | 40 | 1.00% | 1,024 | 25.47% | 4,020 |
| Craig County | 1,112 | 55.46% | 864 | 43.09% | 29 | 1.45% | 248 | 12.37% | 2,005 |
| Culpeper County | 5,896 | 68.57% | 2,555 | 29.71% | 148 | 1.72% | 3,341 | 38.85% | 8,599 |
| Cumberland County | 1,978 | 62.61% | 1,132 | 35.83% | 49 | 1.55% | 846 | 26.78% | 3,159 |
| Dickenson County | 3,091 | 40.65% | 4,461 | 58.67% | 52 | 0.68% | -1,370 | -18.02% | 7,604 |
| Dinwiddie County | 4,165 | 54.38% | 3,405 | 44.46% | 89 | 1.16% | 760 | 9.92% | 7,659 |
| Essex County | 2,038 | 60.56% | 1,294 | 38.45% | 33 | 0.98% | 744 | 22.11% | 3,365 |
| Fairfax County | 200,641 | 61.10% | 125,711 | 38.28% | 2,013 | 0.61% | 74,930 | 22.82% | 328,365 |
| Fauquier County | 11,733 | 69.86% | 4,837 | 28.80% | 226 | 1.35% | 6,896 | 41.06% | 16,796 |
| Floyd County | 2,921 | 61.69% | 1,727 | 36.47% | 87 | 1.84% | 1,194 | 25.22% | 4,735 |
| Fluvanna County | 2,447 | 60.29% | 1,562 | 38.48% | 50 | 1.23% | 885 | 21.80% | 4,059 |
| Franklin County | 7,391 | 55.73% | 5,734 | 43.24% | 136 | 1.03% | 1,657 | 12.50% | 13,261 |
| Frederick County | 9,921 | 72.33% | 3,707 | 27.02% | 89 | 0.65% | 6,214 | 45.30% | 13,717 |
| Giles County | 3,490 | 52.50% | 3,042 | 45.76% | 116 | 1.74% | 448 | 6.74% | 6,648 |
| Gloucester County | 7,646 | 68.38% | 3,372 | 30.16% | 163 | 1.46% | 4,274 | 38.23% | 11,181 |
| Goochland County | 3,765 | 62.61% | 2,209 | 36.74% | 39 | 0.65% | 1,556 | 25.88% | 6,013 |
| Grayson County | 3,968 | 61.51% | 2,441 | 37.84% | 42 | 0.65% | 1,527 | 23.67% | 6,451 |
| Greene County | 2,234 | 69.29% | 899 | 27.88% | 91 | 2.82% | 1,335 | 41.41% | 3,224 |
| Greensville County | 1,610 | 43.13% | 2,083 | 55.80% | 40 | 1.07% | -473 | -12.67% | 3,733 |
| Halifax County | 5,671 | 56.02% | 4,282 | 42.30% | 171 | 1.69% | 1,389 | 13.72% | 10,124 |
| Hanover County | 20,570 | 76.99% | 5,985 | 22.40% | 163 | 0.61% | 14,585 | 54.59% | 26,718 |
| Henrico County | 62,284 | 69.29% | 26,980 | 30.02% | 623 | 0.69% | 35,304 | 39.28% | 89,887 |
| Henry County | 10,871 | 58.04% | 7,536 | 40.24% | 322 | 1.72% | 3,335 | 17.81% | 18,729 |
| Highland County | 807 | 62.75% | 456 | 35.46% | 23 | 1.79% | 351 | 27.29% | 1,286 |
| Isle of Wight County | 5,779 | 60.07% | 3,747 | 38.95% | 95 | 0.99% | 2,032 | 21.12% | 9,621 |
| James City County | 8,945 | 64.95% | 4,642 | 33.70% | 186 | 1.35% | 4,303 | 31.24% | 13,773 |
| King and Queen County | 1,376 | 50.46% | 1,309 | 48.00% | 42 | 1.54% | 67 | 2.46% | 2,727 |
| King George County | 2,587 | 62.40% | 1,519 | 36.64% | 40 | 0.96% | 1,068 | 25.76% | 4,146 |
| King William County | 2,735 | 62.89% | 1,561 | 35.89% | 53 | 1.22% | 1,174 | 26.99% | 4,349 |
| Lancaster County | 3,380 | 67.02% | 1,551 | 30.76% | 112 | 2.22% | 1,829 | 36.27% | 5,043 |
| Lee County | 4,080 | 45.11% | 4,906 | 54.24% | 59 | 0.65% | -826 | -9.13% | 9,045 |
| Loudoun County | 20,448 | 66.26% | 10,101 | 32.73% | 313 | 1.01% | 10,347 | 33.53% | 30,862 |
| Louisa County | 3,831 | 57.16% | 2,789 | 41.61% | 82 | 1.22% | 1,042 | 15.55% | 6,702 |
| Lunenburg County | 2,530 | 56.27% | 1,870 | 41.59% | 96 | 2.14% | 660 | 14.68% | 4,496 |
| Madison County | 2,501 | 62.12% | 1,427 | 35.44% | 98 | 2.43% | 1,074 | 26.68% | 4,026 |
| Mathews County | 2,752 | 67.52% | 1,235 | 30.30% | 89 | 2.18% | 1,517 | 37.22% | 4,076 |
| Mecklenburg County | 5,887 | 63.45% | 3,275 | 35.30% | 116 | 1.25% | 2,612 | 28.15% | 9,278 |
| Middlesex County | 2,571 | 63.99% | 1,361 | 33.87% | 86 | 2.14% | 1,210 | 30.11% | 4,018 |
| Montgomery County | 12,326 | 57.48% | 8,909 | 41.55% | 209 | 0.97% | 3,417 | 15.93% | 21,444 |
| Nelson County | 2,502 | 51.60% | 2,272 | 46.86% | 75 | 1.55% | 230 | 4.74% | 4,849 |
| New Kent County | 2,917 | 66.54% | 1,427 | 32.55% | 40 | 0.91% | 1,490 | 33.99% | 4,384 |
| Northampton County | 2,562 | 52.00% | 2,242 | 45.50% | 123 | 2.50% | 320 | 6.49% | 4,927 |
| Northumberland County | 2,984 | 65.14% | 1,506 | 32.87% | 91 | 1.99% | 1,478 | 32.26% | 4,581 |
| Nottoway County | 3,161 | 57.38% | 2,217 | 40.24% | 131 | 2.38% | 944 | 17.14% | 5,509 |
| Orange County | 4,319 | 61.57% | 2,592 | 36.95% | 104 | 1.48% | 1,727 | 24.62% | 7,015 |
| Page County | 5,013 | 66.18% | 2,499 | 32.99% | 63 | 0.83% | 2,514 | 33.19% | 7,575 |
| Patrick County | 3,990 | 64.06% | 2,093 | 33.60% | 146 | 2.34% | 1,897 | 30.45% | 6,229 |
| Pittsylvania County | 12,229 | 63.69% | 6,612 | 34.44% | 360 | 1.87% | 5,617 | 29.25% | 19,201 |
| Powhatan County | 4,040 | 72.91% | 1,467 | 26.48% | 34 | 0.61% | 2,573 | 46.44% | 5,541 |
| Prince Edward County | 3,147 | 55.02% | 2,434 | 42.55% | 139 | 2.43% | 713 | 12.47% | 5,720 |
| Prince George County | 4,982 | 66.29% | 2,469 | 32.85% | 64 | 0.85% | 2,513 | 33.44% | 7,515 |
| Prince William County | 39,654 | 66.70% | 19,198 | 32.29% | 601 | 1.01% | 20,456 | 34.41% | 59,453 |
| Pulaski County | 6,844 | 58.40% | 4,686 | 39.99% | 189 | 1.61% | 2,158 | 18.41% | 11,719 |
| Rappahannock County | 1,657 | 61.69% | 1,003 | 37.34% | 26 | 0.97% | 654 | 24.35% | 2,686 |
| Richmond County | 1,862 | 66.24% | 924 | 32.87% | 25 | 0.89% | 938 | 33.37% | 2,811 |
| Roanoke County | 22,011 | 62.61% | 12,938 | 36.80% | 208 | 0.59% | 9,073 | 25.81% | 35,157 |
| Rockbridge County | 3,541 | 58.41% | 2,412 | 39.79% | 109 | 1.80% | 1,129 | 18.62% | 6,062 |
| Rockingham County | 13,241 | 72.59% | 4,716 | 25.85% | 284 | 1.56% | 8,525 | 46.74% | 18,241 |
| Russell County | 4,374 | 40.68% | 6,222 | 57.86% | 157 | 1.46% | -1,848 | -17.19% | 10,753 |
| Scott County | 4,986 | 56.76% | 3,616 | 41.16% | 183 | 2.08% | 1,370 | 15.59% | 8,785 |
| Shenandoah County | 8,612 | 71.74% | 3,276 | 27.29% | 116 | 0.97% | 5,336 | 44.45% | 12,004 |
| Smyth County | 7,446 | 63.49% | 3,989 | 34.02% | 292 | 2.49% | 3,457 | 29.48% | 11,727 |
| Southampton County | 3,439 | 52.96% | 3,000 | 46.20% | 54 | 0.83% | 439 | 6.76% | 6,493 |
| Spotsylvania County | 10,978 | 66.16% | 5,486 | 33.06% | 129 | 0.78% | 5,492 | 33.10% | 16,593 |
| Stafford County | 12,234 | 69.07% | 5,380 | 30.37% | 98 | 0.55% | 6,854 | 38.70% | 17,712 |
| Surry County | 1,246 | 42.98% | 1,602 | 55.26% | 51 | 1.76% | -356 | -12.28% | 2,899 |
| Sussex County | 1,822 | 46.77% | 1,958 | 50.26% | 116 | 2.98% | -136 | -3.49% | 3,896 |
| Tazewell County | 7,165 | 46.37% | 8,098 | 52.40% | 190 | 1.23% | -933 | -6.04% | 15,453 |
| Warren County | 4,700 | 61.86% | 2,769 | 36.44% | 129 | 1.70% | 1,931 | 25.41% | 7,598 |
| Washington County | 10,722 | 63.45% | 5,819 | 34.43% | 358 | 2.12% | 4,903 | 29.01% | 16,899 |
| Westmoreland County | 2,974 | 55.38% | 2,311 | 43.04% | 85 | 1.58% | 663 | 12.35% | 5,370 |
| Wise County | 6,189 | 46.23% | 7,017 | 52.42% | 180 | 1.34% | -828 | -6.19% | 13,386 |
| Wythe County | 5,827 | 63.17% | 3,201 | 34.70% | 197 | 2.14% | 2,626 | 28.47% | 9,225 |
| York County | 11,103 | 69.96% | 4,639 | 29.23% | 129 | 0.81% | 6,464 | 40.73% | 15,871 |
| Alexandria City | 20,913 | 45.66% | 24,358 | 53.18% | 533 | 1.16% | -3,445 | -7.52% | 45,804 |
| Bedford City | 1,322 | 56.79% | 960 | 41.24% | 46 | 1.98% | 362 | 15.55% | 2,328 |
| Bristol City | 4,407 | 63.92% | 2,446 | 35.47% | 42 | 0.61% | 1,961 | 28.44% | 6,895 |
| Buena Vista City | 1,121 | 56.08% | 828 | 41.42% | 50 | 2.50% | 293 | 14.66% | 1,999 |
| Charlottesville City | 5,817 | 42.61% | 7,671 | 56.19% | 164 | 1.20% | -1,854 | -13.58% | 13,652 |
| Chesapeake City | 29,738 | 60.87% | 18,828 | 38.54% | 289 | 0.59% | 10,910 | 22.33% | 48,855 |
| Clifton Forge City | 759 | 43.65% | 961 | 55.26% | 19 | 1.09% | -202 | -11.62% | 1,739 |
| Colonial Heights City | 6,001 | 78.57% | 1,581 | 20.70% | 56 | 0.73% | 4,420 | 57.87% | 7,638 |
| Covington City | 1,274 | 43.70% | 1,567 | 53.76% | 74 | 2.54% | -293 | -10.05% | 2,915 |
| Danville City | 12,221 | 61.49% | 7,353 | 37.00% | 300 | 1.51% | 4,868 | 24.49% | 19,874 |
| Emporia City | 1,289 | 56.61% | 977 | 42.91% | 11 | 0.48% | 312 | 13.70% | 2,277 |
| Fairfax City | 5,576 | 61.27% | 3,430 | 37.69% | 95 | 1.04% | 2,146 | 23.58% | 9,101 |
| Falls Church City | 2,470 | 49.51% | 2,484 | 49.79% | 35 | 0.70% | -14 | -0.28% | 4,989 |
| Franklin City | 1,557 | 48.50% | 1,630 | 50.78% | 23 | 0.72% | -73 | -2.27% | 3,210 |
| Fredericksburg City | 3,401 | 55.26% | 2,683 | 43.60% | 70 | 1.14% | 718 | 11.67% | 6,154 |
| Galax City | 1,278 | 58.09% | 907 | 41.23% | 15 | 0.68% | 371 | 16.86% | 2,200 |
| Hampton City | 24,034 | 54.85% | 19,106 | 43.60% | 678 | 1.55% | 4,928 | 11.25% | 43,818 |
| Harrisonburg City | 5,376 | 64.86% | 2,799 | 33.77% | 113 | 1.36% | 2,577 | 31.09% | 8,288 |
| Hopewell City | 4,672 | 63.48% | 2,566 | 34.86% | 122 | 1.66% | 2,106 | 28.61% | 7,360 |
| Lexington City | 994 | 49.11% | 997 | 49.26% | 33 | 1.63% | -3 | -0.15% | 2,024 |
| Lynchburg City | 15,323 | 64.04% | 8,279 | 34.60% | 324 | 1.35% | 7,044 | 29.44% | 23,926 |
| Manassas City | 5,980 | 68.59% | 2,658 | 30.49% | 81 | 0.93% | 3,322 | 38.10% | 8,719 |
| Manassas Park City | 993 | 68.67% | 434 | 30.01% | 19 | 1.31% | 559 | 38.66% | 1,446 |
| Martinsville City | 3,360 | 53.64% | 2,794 | 44.60% | 110 | 1.76% | 566 | 9.04% | 6,264 |
| Newport News City | 32,570 | 59.88% | 21,413 | 39.37% | 412 | 0.76% | 11,157 | 20.51% | 54,395 |
| Norfolk City | 30,538 | 44.33% | 37,778 | 54.84% | 575 | 0.83% | -7,240 | -10.51% | 68,891 |
| Norton City | 608 | 42.73% | 795 | 55.87% | 20 | 1.41% | -187 | -13.14% | 1,423 |
| Petersburg City | 4,231 | 33.60% | 8,177 | 64.94% | 183 | 1.45% | -3,946 | -31.34% | 12,591 |
| Poquoson City | 3,840 | 80.83% | 877 | 18.46% | 34 | 0.72% | 2,963 | 62.37% | 4,751 |
| Portsmouth City | 16,087 | 44.61% | 19,698 | 54.63% | 274 | 0.76% | -3,611 | -10.01% | 36,059 |
| Radford City | 2,481 | 56.84% | 1,855 | 42.50% | 29 | 0.66% | 626 | 14.34% | 4,365 |
| Richmond City | 31,586 | 42.26% | 42,155 | 56.41% | 995 | 1.33% | -10,569 | -14.14% | 74,736 |
| Roanoke City | 15,389 | 46.90% | 17,185 | 52.37% | 239 | 0.73% | -1,796 | -5.47% | 32,813 |
| Salem City | 5,694 | 59.77% | 3,760 | 39.47% | 73 | 0.77% | 1,934 | 20.30% | 9,527 |
| South Boston City | 1,694 | 64.05% | 936 | 35.39% | 15 | 0.57% | 758 | 28.66% | 2,645 |
| Staunton City | 5,775 | 69.29% | 2,457 | 29.48% | 102 | 1.22% | 3,318 | 39.81% | 8,334 |
| Suffolk City | 9,742 | 54.27% | 8,080 | 45.01% | 128 | 0.71% | 1,662 | 9.26% | 17,950 |
| Virginia Beach City | 76,481 | 68.89% | 33,780 | 30.43% | 757 | 0.68% | 42,701 | 38.46% | 111,018 |
| Waynesboro City | 4,672 | 68.72% | 2,038 | 29.97% | 89 | 1.31% | 2,634 | 38.74% | 6,799 |
| Williamsburg City | 1,648 | 50.91% | 1,534 | 47.39% | 55 | 1.70% | 114 | 3.52% | 3,237 |
| Winchester City | 4,497 | 65.53% | 2,300 | 33.52% | 65 | 0.95% | 2,197 | 32.02% | 6,862 |
| Totals | 1,309,162 | 59.74% | 859,799 | 39.23% | 22,648 | 1.03% | 449,363 | 20.50% | 2,191,609 |
See also
References
- "1988 Presidential General Election Results – Virginia". Dave Leip’s Atlas of U.S. Presidential Elections. Retrieved 2018-01-07.
- Sullivan, Robert David; ‘How the Red and Blue Map Evolved Over the Past Century’; America Magazine in The National Catholic Review; June 29, 2016
- 'Virginia...is the heart of the Republican base in the South.' (Jeff Greenfield, November 7, 2000) https://www.youtube.com/watch?v=L7jRMYRP9PU&feature=youtu.be&t=7241 Retrieved 2020-11-30.
- Priest, Dana (1989-10-01). "COAL STRIKE STUBBORNLY PASSES 6-MONTH MARK IN VA". Washington Post. ISSN 0190-8286. Retrieved 2020-11-30.
- "Since 1980s, the Kindest of Tax Cuts for the Rich". The New York Times. 2012-01-18. Retrieved 2013-07-21.
- Jerry Lanson (2008-11-06). "A historic victory. A changed nation. Now, can Obama deliver?". Christian Science Monitor. Retrieved 2013-07-21.
- http://clerk.house.gov/member_info/electionInfo/1988election.pdf