List of countries by apple production
This is a list of countries by apple production in 2016 and 2017, based on data from the Food and Agriculture Organization Corporate Statistical Database.[1] The estimated total world production of
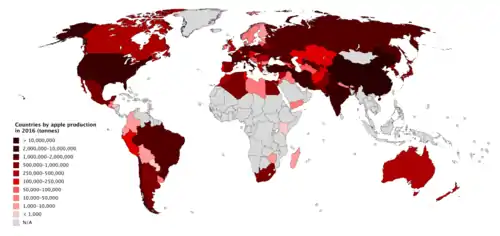
Countries by apple production in 2016
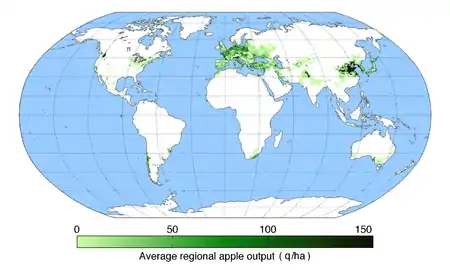
A map of apple output in 2005.
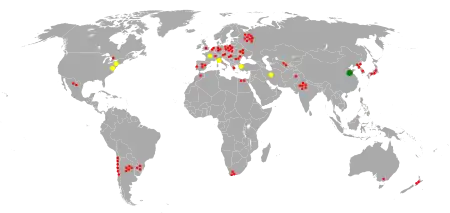
A map of world apple producing regions in 2000.
List of countries by production quantity
>1,000,000 tonnes
| Rank | Country/Region | 2017 | 2016 |
|---|---|---|---|
| – | World | 83,139,326 | 85,204,410 |
| 1 | 41,390,000 | 40,393,000 | |
| 2 | 5,173,670 | 5,160,750 | |
| 3 | 3,032,164 | 2,925,828 | |
| 4 | 2,441,393 | 3,604,271 | |
| 5 | 2,265,000 | 2,521,000 | |
| 6 | 2,096,749 | 2,470,028 | |
| 7 | 1,921,272 | 2,455,616 | |
| 8 | 1,766,210 | 1,743,172 | |
| 9 | 1,710,755 | 1,819,762 | |
| 10 | 1,639,421 | 1,843,544 | |
| 11 | 1,300,943 | 1,049,251 | |
| 12 | 1,076,180 | 1,099,240 | |
| 13 | 1,028,796 | 1,033,598 | |
100,000–1,000,000 tonnes
| Rank | Country/Region | 2017 | 2016 |
|---|---|---|---|
| 14 | 994,710 | 967,847 | |
| 15 | 924,375 | 913,471 | |
| 16 | 820,547 | 406,379 | |
| 17 | 798,574 | 754,846 | |
| 18 | 782,143 | 778,622 | |
| 19 | 735,200 | 765,000 | |
| 20 | 714,149 | 716,931 | |
| 21 | 596,666 | 1,032,913 | |
| 22 | 587,034 | 621,164 | |
| 23 | 542,040 | 576,369 | |
| 24 | 494,239 | 500,855 | |
| 25 | 488,102 | 589,171 | |
| 26 | 459,612 | 497,108 | |
| 27 | 454,091 | 450,842 | |
| 28 | 446,400 | 481,100 | |
| 29 | 378,644 | 400,473 | |
| 30 | 353,534 | 352,905 | |
| 31 | 345,568 | 408,404 | |
| 32 | 339,570 | 467,259 | |
| 33 | 329,371 | 241,611 | |
| 34 | 317,078 | 508,816 | |
| 35 | 313,730 | 308,298 | |
| 36 | 303,155 | 411,768 | |
| 37 | 282,300 | 291,750 | |
| 38 | 275,093 | 254,296 | |
| 39 | 230,443 | 220,949 | |
| 40 | 227,000 | 317,000 | |
| 41 | 225,622 | 227,300 | |
| 42 | 185,244 | 101,667 | |
| 43 | 181,057 | 188,099 | |
| 44 | 175,000 | 140,903 | |
| 45 | 149,787 | 158,098 | |
| 46 | 147,593 | 135,374 | |
| 47 | 123,770 | 124,449 | |
| 48 | 122,834 | 126,000 | |
| 49 | 116,051 | 62,574 | |
| 50 | 113,000 | 100,000 | |
| 51 | 105,280 | 124,997 | |
50,000–100,000 tonnes
| Rank | Country/Region | 2017 | 2016 |
|---|---|---|---|
| 52 | 96,338 | 101,532 | |
| 53 | 95,879 | 91,935 | |
| 54 | 87,367 | 65,579 | |
| 55 | 86,236 | 238,244 | |
| 56 | 80,000 | 59,573 | |
| 57 | 56,570 | 44,781 | |
| 58 | 56,230 | 51,751 | |
| 59 | 52,696 | 55,197 | |
| 60 | 52,252 | 69,062 | |
10,000–50,000 tonnes
| Rank | Country/Region | 2017 | 2016 |
|---|---|---|---|
| 61 | 47,626 | 44,495 | |
| 62 | 45,128 | 37,675 | |
| 63 | 44,927 | 44,755 | |
| 64 | 43,366 | 101,088 | |
| 65 | 32,478 | 20,722 | |
| 66 | 25,109 | 26,499 | |
| 67 | 22,130 | 26,280 | |
| 68 | 21,400 | 21,800 | |
| 69 | 20,496 | 36,470 | |
| 70 | 19,850 | 41,011 | |
| 71 | 19,700 | 65,200 | |
| 72 | 17,550 | 17,362 | |
| 73 | 15,106 | 15,801 | |
| 74 | 12,664 | 12,356 | |
1,000–10,000 tonnes
| Rank | Country/Region | 2017 | 2016 |
|---|---|---|---|
| 75 | 8,039 | 6,587 | |
| 76 | 7,464 | 9,854 | |
| 77 | 7,283 | 7,432 | |
| 78 | 7,126 | 7,104 | |
| 79 | 6,779 | 6,760 | |
| 80 | 6,758 | 6,401 | |
| 81 | 4,067 | 4,200 | |
| 82 | 3,648 | 5,497 | |
| 83 | 3,447 | 3,313 | |
| 84 | 2,580 | 2,578 | |
| 85 | 1,970 | 2,259 | |
| 86 | 1,500 | 1,483 | |
| 87 | 1,350 | 1,640 | |
| 88 | 1,087 | 1,046 | |
List of countries by area harvested for apples
This is a list of the top ten countries by area harvested for apples in hectares (ha). The total area harvested in the world for apples was 4,933,841 hectares in 2017, down 6.8% from 5,293,340 hectares in 2016.[2]
| Rank | Country | 2017 | 2016 |
|---|---|---|---|
| 1 | 2,220,430 | 2,380,256 | |
| 2 | 305,000 | 277,000 | |
| 3 | 188,251 | 214,449 | |
| 4 | 176,352 | 177,203 | |
| 5 | 175,357 | 173,394 | |
| 6 | 130,710 | 131,160 | |
| 7 | 119,528 | 151,645 | |
| 8 | 94,517 | 95,405 | |
| 9 | 91,200 | 91,600 | |
| 10 | 78,302 | 90,607 | |
Notes
References
- "Crops". FAOSTAT. Retrieved 30 April 2019. Countries - Select All; Regions - World + (Total); Elements - Production Quantity; Items - Apples; Years - 2017 + 2016
- "Crops". FAOSTAT. Retrieved 30 April 2019. Countries - Select All; Regions - World + (Total); Elements - Area harvested; Items - Apples; Years - 2017 + 2016
External links
This article is issued from Wikipedia. The text is licensed under Creative Commons - Attribution - Sharealike. Additional terms may apply for the media files.