List of countries by pineapple production
This is a list of countries by pineapple production in 2016 and 2017, based on data from the Food and Agriculture Organization Corporate Statistical Database.[1] The estimated total world production for pineapples in 2017 was 27,402,956 metric tonnes, an increase of 4.6% from 26,195,845 tonnes in 2016.[n 1] Dependent territories are shown in italics.
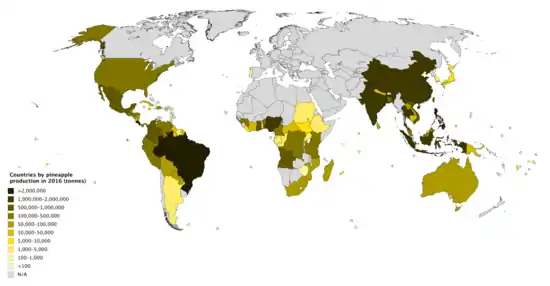
Countries by pineapple production in 2016
Production by country
>100,000 tonnes
| Rank | Country | 2017 | 2016 |
|---|---|---|---|
| 1 | 3,056,445 | 2,930,661 | |
| 2 | 2,671,711 | 2,612,474 | |
| 3 | 2,253,897 | 2,695,230 | |
| 4 | 2,123,177 | 1,778,439 | |
| 5 | 1,861,000 | 1,924,000 | |
| 6 | 1,810,986 | 1,396,153 | |
| 7 | 1,642,376 | 1,578,090 | |
| 8 | 1,576,405 | 1,550,947 | |
| 9 | 1,091,042 | 980,082 | |
| 10 | 945,210 | 875,839 | |
| 11 | 727,224 | 662,709 | |
| 12 | 677,112 | 661,500 | |
| 13 | 617,944 | 555,407 | |
| 14 | 553,531 | 527,161 | |
| 15 | 494,642 | 461,286 | |
| 16 | 486,398 | 478,167 | |
| 17 | 434,969 | 417,338 | |
| 18 | 384,165 | 375,506 | |
| 19 | 360,257 | 220,524 | |
| 20 | 351,574 | 332,664 | |
| 21 | 344,515 | 327,453 | |
| 22 | 340,722 | 391,714 | |
| 23 | 293,500 | 203,524 | |
| 24 | 211,833 | 200,701 | |
| 25 | 204,850 | 224,190 | |
| 26 | 189,286 | 190,515 | |
| 27 | 165,307 | 116,044 | |
| 28 | 154,457 | 153,181 | |
| 29 | 140,407 | 142,064 | |
| 30 | 134,989 | 132,541 | |
| 31 | 103,149 | 88,763 | |
10,000–100,000 tonnes
| Rank | Country | 2017 | 2016 |
|---|---|---|---|
| 32 | 97,215 | 94,394 | |
| 33 | 86,022 | 85,256 | |
| 34 | 85,922 | 71,782 | |
| 35 | 79,089 | 77,797 | |
| 36 | 73,401 | 69,784 | |
| 37 | 63,585 | 62,397 | |
| 38 | 63,400 | 63,383 | |
| 39 | 53,122 | 48,501 | |
| 40 | 49,000 | 39,000 | |
| 41 | 42,229 | 44,977 | |
| 42 | 32,470 | 58,400 | |
| 43 | 25,848 | 25,296 | |
| 44 | 24,539 | 24,172 | |
| 45 | 22,887 | 22,729 | |
| 46 | 22,290 | 27,378 | |
| 47 | 19,236 | 11,167 | |
| 48 | 17,239 | 17,640 | |
| 49 | 16,930 | 27,534 | |
| 50 | 15,560 | 15,445 | |
| 51 | 11,540 | 13,291 | |
| 52 | 10,268 | 8,968 | |
1,000–10,000 tonnes
| Rank | Country | 2017 | 2016 |
|---|---|---|---|
| 53 | 9,550 | 7,849 | |
| 54 | 8,823 | 8,714 | |
| 55 | 8,760 | 9,707 | |
| 56 | 7,608 | 7,770 | |
| 57 | 7,543 | 7,361 | |
| 58 | 7,526 | 7,200 | |
| 59 | 5,906 | 5,135 | |
| 60 | 5,500 | 5,000 | |
| 61 | 4,582 | 4,560 | |
| 62 | 4,125 | 4,096 | |
| 63 | 3,999 | 3,962 | |
| 64 | 3,728 | 4,460 | |
| 65 | 3,642 | 3,520 | |
| 66 | 3,263 | 3,549 | |
| 67 | 3,163 | 3,177 | |
| 68 | 2,500 | 3,000 | |
| 69 | 1,953 | 1,908 | |
| 70 | 1,883 | 1,424 | |
| 71 | 1,205 | 1,183 | |
| 72 | 1,203 | 1,192 | |
| 73 | 1,189 | 1,274 | |
| 74 | 1,031 | 1,023 | |
<1,000 tonnes
| Rank | Country | 2017 | 2016 |
|---|---|---|---|
| 75 | 965 | 1,184 | |
| 76 | 948 | 998 | |
| 77 | 606 | 590 | |
| 78 | 489 | 477 | |
| 79 | 420 | 408 | |
| 80 | 247 | 230 | |
| 81 | 194 | 221 | |
| 82 | 140 | 139 | |
| 83 | 132 | 132 | |
| 84 | 102 | 99 | |
| 85 | 40 | 20 | |
| 85 | 40 | 43 | |
| 87 | 27 | 27 | |
| 88 | 25 | 22 | |
| 88 | 25 | 26 | |
| 90 | 5 | 5 | |
Notes
- Sum of values for countries with available data, which may be official or FAO data based on imputation methodology
References
- "Crops". FAOSTAT. Retrieved 5 August 2019. Countries - Select All; Regions - World + (Total); Elements - Production Quantity; Items - Pineapples; Years - 2017 + 2016
This article is issued from Wikipedia. The text is licensed under Creative Commons - Attribution - Sharealike. Additional terms may apply for the media files.