List of countries by soybean production
This is a list of countries by soybean production in 2018, based on data from the Food and Agriculture Organization Corporate Statistical Database.[1] The total world production for soybeans in 2018 was 348,712,311 metric tonnes. Brazil was the largest producer, accounting for 36% of world production.[2]
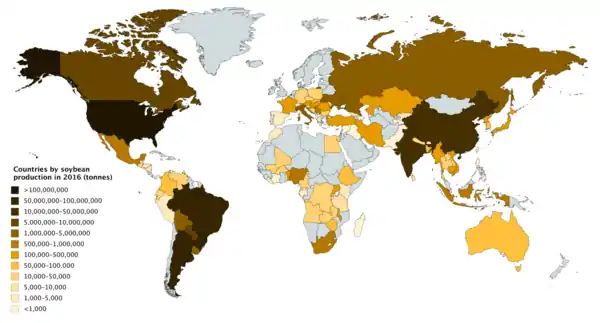
Countries by soybean production in 2016
Production by country
1,000,000 tonnes
| Rank | Country | 2018 |
|---|---|---|
| 1 | 125,887,672 | |
| 2 | 123,664,230 | |
| 3 | 37,787,927 | |
| 4 | 14,193,621 | |
| 5 | 13,786,000 | |
| 6 | 11,045,971 | |
| 7 | 7,266,600 | |
| 8 | 4,460,770 | |
| 9 | 4,026,850 | |
| 10 | 2,942,131 | |
| 11 | 1,540,000 | |
| 12 | 1,334,000 | |
| 13 | 1,138,993 |
100,000–1,000,000 tonnes
| Rank | Country | 2018 |
|---|---|---|
| 14 | 953,571 | |
| 15 | 758,033 | |
| 16 | 645,607 | |
| 17 | 465,609 | |
| 18 | 400,292 | |
| 19 | 324,011 | |
| 20 | 302,720 | |
| 21 | 255,437 | |
| 22 | 245,188 | |
| 23 | 221,977 | |
| 24 | 211,300 | |
| 25 | 210,000 | |
| 26 | 184,342 | |
| 27 | 178,200 | |
| 28 | 175,475 | |
| 29 | 170,985 | |
| 30 | 170,000 | |
| 31 | 140,000 | |
| 32 | 135,000 | |
| 33 | 104,525 | |
10,000–100,000 tonnes
| Rank | Country | 2018 |
|---|---|---|
| 34 | 98,699 | |
| 35 | 98,000 | |
| 36 | 90,000 | |
| 37 | 89,410 | |
| 38 | 81,348 | |
| 39 | 77,000 | |
| 40 | 63,000 | |
| 41 | 59,000 | |
| 42 | 57,684 | |
| 43 | 56,000 | |
| 44 | 48,000 | |
| 45 | 38,000 | |
| 46 | 31,314 | |
| 47 | 29,000 | |
| 48 | 27,681 | |
| 49 | 25,772 | |
| 50 | 25,504 | |
| 51 | 25,559 | |
| 52 | 23,804 | |
| 53 | 23,332 | |
| 54 | 20,824 | |
| 55 | 11,776 | |
| 56 | 11,557 | |
| 57 | 10,271 | |
| 58 | 10,000 |
<10,000 tonnes
| Rank | Country | 2018 |
|---|---|---|
| 59 | 9,490 | |
| 60 | 8,380 | |
| 61 | 6,693 | |
| 62 | 6,000 | |
| 63 | 5,993 | |
| 64 | 5,694 | |
| 65 | 5,331 | |
| 66 | 5,206 | |
| 67 | 4,548 | |
| 68 | 4,404 | |
| 69 | 4,249 | |
| 70 | 4,057 | |
| 71 | 3,290 | |
| 72 | 2,872 | |
| 73 | 2,500 | |
| 74 | 2,387 | |
| 75 | 2,304 | |
| 76 | 2,000 | |
| 77 | 1,559 | |
| 78 | 1,530 | |
| 79 | 1,008 | |
| 80 | 982 | |
| 81 | 744 | |
| 82 | 732 | |
| 83 | 658 | |
| 84 | 300 | |
| 85 | 226 | |
| 86 | 88 | |
| 87 | 44 | |
| 88 | 41 | |
| 89 | 29 | |
| 90 | 29 | |
| 91 | 26 | |
| 92 | 20 | |
| 93 | 7 | |
References
- "Crops". FAOSTAT. Retrieved 20 May 2020. Countries - Select All; Regions - World + (Total); Elements - Production Quantity; Items - Soybeans; Years - 2018
- "Market in telligence". Retrieved 1 March 2018.
This article is issued from Wikipedia. The text is licensed under Creative Commons - Attribution - Sharealike. Additional terms may apply for the media files.